MalChela 2.2 “REMnux” Release

MalChela’s 2.2 update is packed with practical and platform-friendly improvements. It includes native support for REMnux, better tool settings, and deeper integrations with analysis tools like YARA-X, Tshark, Volatility3, and the newly improved fileanalyzer module.

🦀 REMnux Edition: Built-In Support, Zero Tweaks

When the GUI loads a REMnux-specific tools.yaml profile, it enters REMnux mode.

Screenshot of yaml configuration applying REMnux mode

Native binaries and Python scripts like capa, oledump.py, olevba, and FLOSS are loaded into the MalChela tools menu, allowing you to mix and match operations with the embedded MalChela utilities and the full REMnux tool stack. No manual configuration needed—just launch and go. MalChela currently supports the following REMnux programs right out of the box:

Tool Name Description
binwalkFirmware analysis and extraction tool
capaIdentifies capabilities in executable files
radare2Advanced reverse engineering framework
Volatility 3Memory forensics framework for RAM analysis
exiftoolExtracts metadata from images, documents, and more
TSharkTerminal-based network packet analyzer (Wireshark CLI)
mraptorDetects malicious macros in Office documents
oledumpParses OLE files and embedded streams
oleidIdentifies features in OLE files that may indicate threats
olevbaExtracts and analyzes VBA macros from Office files
rtfobjExtracts embedded objects from RTF documents
zipdumpInspects contents of ZIP files, including suspicious payloads
pdf-parserAnalyzes structure and contents of suspicious PDFs
FLOSSReveals obfuscated and decoded strings in binaries
clamscanOn-demand virus scanner using ClamAV engine
stringsExtracts printable strings from binary files
YARA-XNext-generation high-performance YARA rule scanner

If you only need a subset of tools you can easily save and restore that a custom profile.


TShark Panel with Built-In Reference

Tshark and the integrated field reference

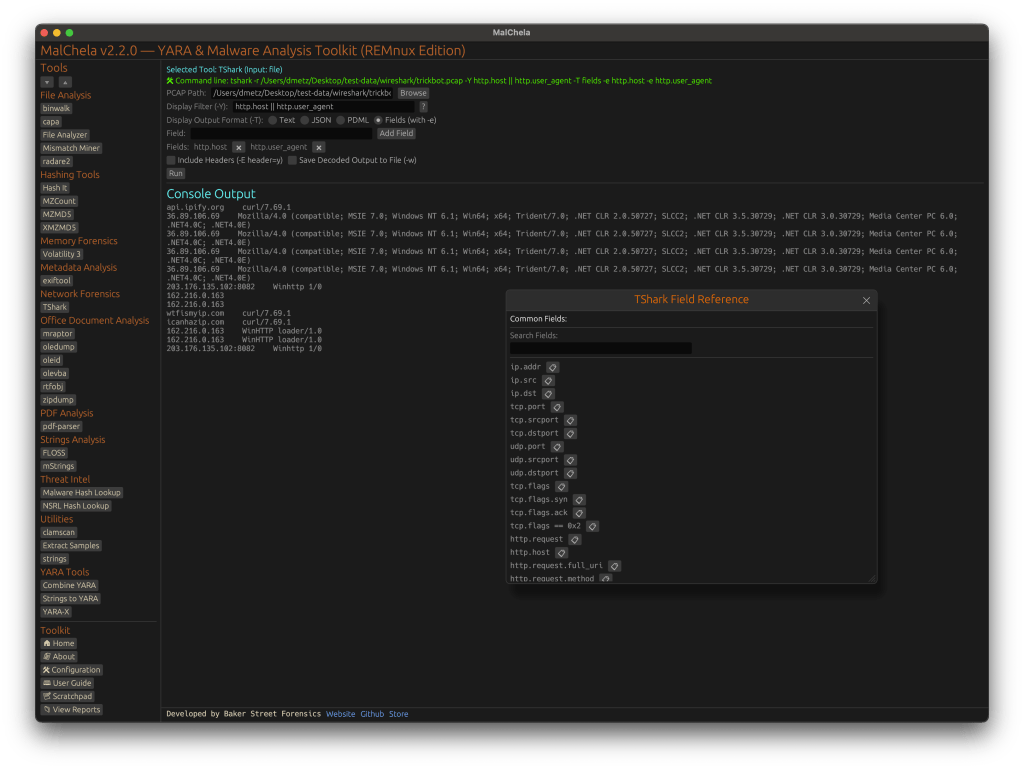
A new TShark integration exposes features including:

  • A filter builder panel
  • Commonly used fields reference
  • Tooltip hints for each example (e.g., `ip.addr == 192.168.1.1` shows “Any traffic to or from 192.168.1.1”)
  • One-click copy support

This helps analysts build and understand filters quickly—even if TShark isn’t something they use every day. Using the syntax builder in MalChela you can use the exact commands directly in Tshark or Wireshark.


YARA-X Support (Install Guide Included)

YARA-X module in MalChela

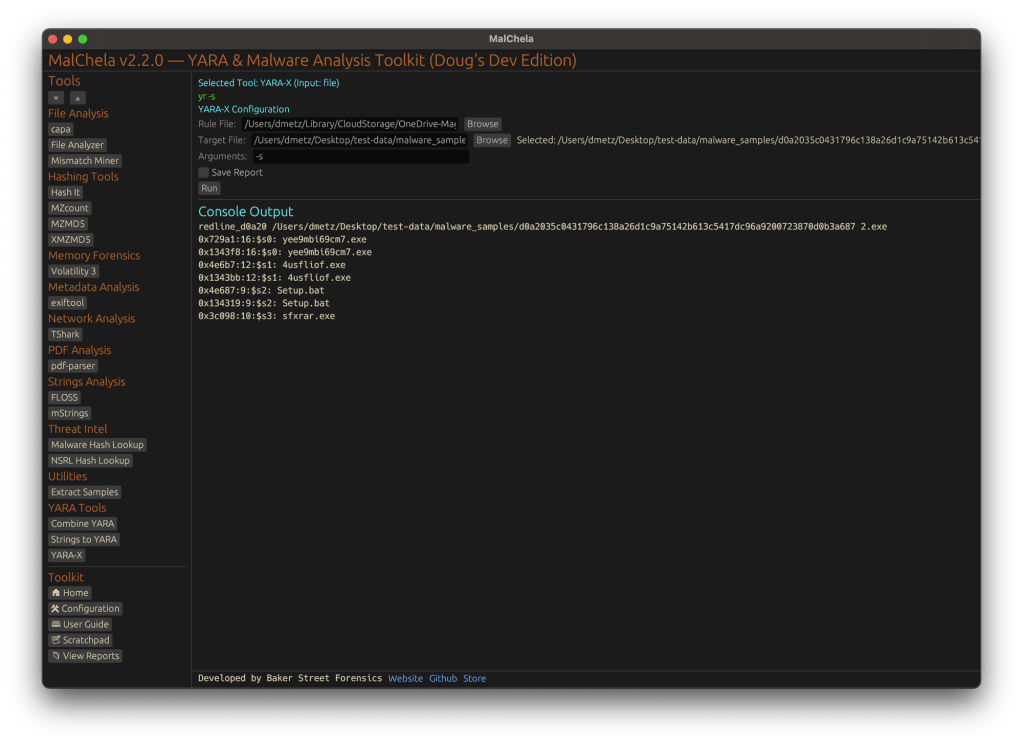
Support for YARA-X (via the `yr` binary) is now built in. YARA-X is not bundled with REMnux by default, but install instructions are included in the User Guide for both macOS and Linux users.

Once installed, MalChela allows for rule-based scanning from the GUI,and with YARA-X, it’s faster than ever.


fileanalyzer: Fuzzy Hashing, PE Metadata, and More

Updated FileAnalyzer Module

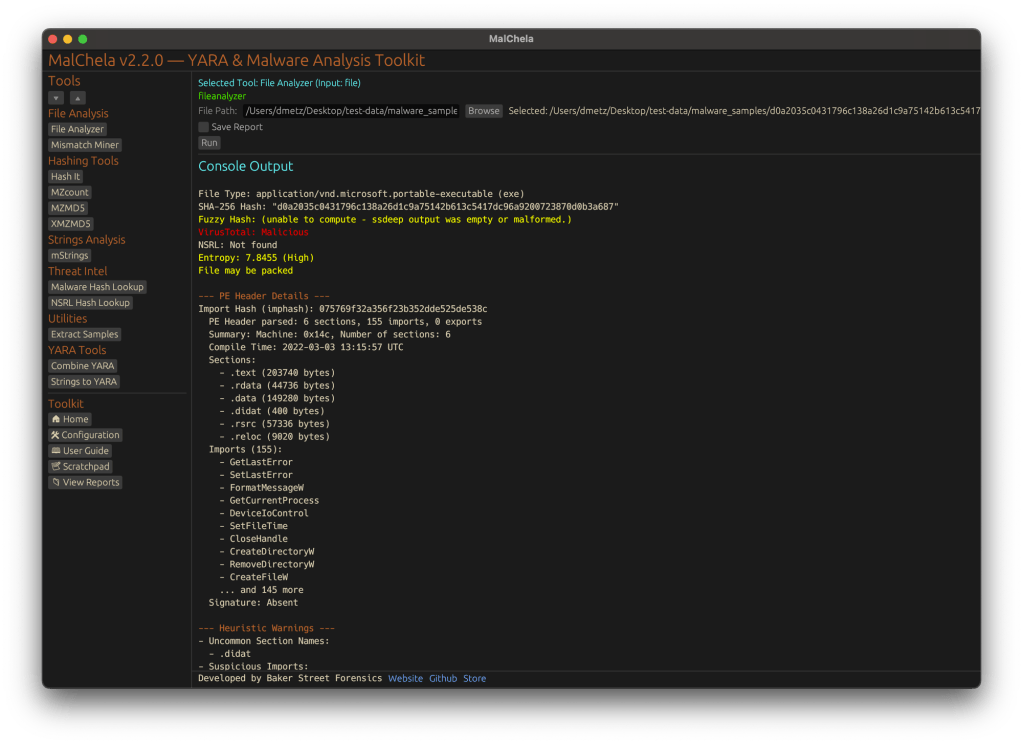
MalChela’s fileanalyzer tool has also been updated to include:

  • Fuzzy hashing support via `ssdeep`
  • BLAKE3 hashing for fast, secure fingerprints
  • Expanded PE analysis, including:
  • Import and Export Table parsing (list of imported and exported functions)
  • Compilation Timestamp (for detection of suspicious or forged build times)
  • Section Characteristics (flags like IMAGE_SCN_MEM_EXECUTE, IMAGE_SCN_CNT_CODE, etc., for detecting anomalous sections)

These improvements provide deeper insight into executable structure, helping analysts detect anomalies such as packers, suspicious timestamps, or unexpected imports/exports. Useful for everything from sample triage to correlation, fileanalyzer now digs deeper—without slowing down.


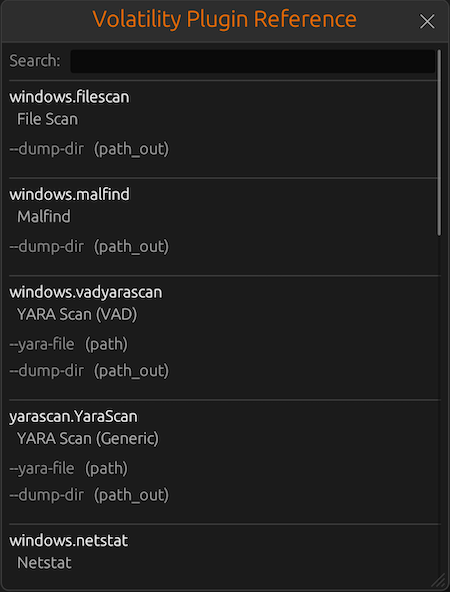
Memory Forensics Gets a Boost: Volatility 3 Now Supported

With the 2.2 release, MalChela introduces support for Volatility 3, the modern Python-based memory forensics framework. Whether you’re running MalChela in REMnux or on a customized macOS or Linux setup, you can now access the full power of Volatility directly from the MalChela GUI.

Volatility 3 in MalChela

There’s an intuitive plugin selector that dynamically adjusts available arguments based on your chosen plugin,. You can search, sort, and browse available plugins, and even toggle output options like –dump-dir with ease.

Like Tshark, there is an added plugin reference panel with searchable descriptions and argument overviews — a real time-saver when navigating Volatility’s deep and often complex toolset.

Volatility Plugin Reference

Smarter Tool Configuration via YAML

The tool configuration system continues to evolve:

  • Tools now declare their input type (file, folder, or hash)
  • The GUI dynamically adjusts the interface to match
  • Alternate profiles (like REMnux setups) can be managed simply by swapping `tools.yaml` files via the GUI
  • Easily backup or restore your custom setups
  • Restore the default toolset to get back to basics

This structure helps keep things clean—whether you’re testing, teaching, or deploying in a lab environment.


Embedded Documentation Access

The GUI now includes a link to the full MalChela User Guide in PDF. You can also access the documentation online.

From tool usage and CLI flags to configuration tips and install steps, it’s all just a click away—especially useful in offline environments or when onboarding new analysts. I’ll be honest, this is likely the most comprehensive user guide I’ve ever written.


Whether you’re reviewing binaries, building hash sets, or exploring network captures—MalChela 2.2 is designed bring together the tools you need, and make it easier to interoperate between them.

The new REMnux mode makes it even easier to get up and running with dozens of third party integrations.

Have an idea for a feature or application you’d like to see supported — reach out to me.


GitHub: REMnux Release

MalChela User Guide: Online, PDF, Web

Shop: T-shirts, hats, stickers, and more

QuickPcap – Capturing a PCAP with PowerShell

Earlier today I was asked for a ‘quick and easy’ PowerShell to grab a packet capture on a Windows box. I didn’t have anything on hand so I set off to the Google and returned with the necessary ingredients.

The star of the show is netsh trace, which is built into Windows. If we wanted to capture for 90 seconds, start the trace, wait 90 seconds, and stop it the syntax would be:

netsh trace start capture=yes IPv4.Address=192.168.1.167 tracefile=c:\temp\capture.etl
Start-Sleep 90
netsh trace stop
  • Note there are 3 lines (the first may wrap depending on windows size)

Like Wireshark, you need to specify what interface you want to capture traffic from. In the example above 192.168.1.167 is the active interface I want to capture. But what if I want to use this for automation and won’t know in advance what the active IP address will be?

We can grab the local IPv4 address and save it as a variable.

#Get the local IPv4 address
$env:HostIP = (
    Get-NetIPConfiguration |
    Where-Object {
        $_.IPv4DefaultGateway -ne $null -and
        $_.NetAdapter.Status -ne "Disconnected"
    }
).IPv4Address.IPAddress

Now putting the two together:

$env:HostIP = (
    Get-NetIPConfiguration |
    Where-Object {
        $_.IPv4DefaultGateway -ne $null -and
        $_.NetAdapter.Status -ne "Disconnected"
    }
).IPv4Address.IPAddress
netsh trace start capture=yes IPv4.Address=$env:HostIP tracefile=c:\temp\capture.etl
Start-Sleep 90
netsh trace stop

Perfect. Automated packet capture without having to install Wireshark on the host. The only item you should need to adjust will be the capture (sleep) timer.

But wait, the request was for a pcap file. Not a .etl. Lucky for us there’s an easy conversion utility etl2pcapng. Execution is as simple as giving the exe the source and destination files.

./etl2pcapng.exe c:\temp\capture.etl c:\temp\capture.pcap

That’s it. We’re now able to collect a packet capture on Windows hosts without adding any additional tools. We can then take those collections and convert them with ease to everyone’s favorite packet analyzer.

I’ve combined everything above into QuickPcap.ps1 available on my GitHub site.

QuickPcap.ps1

In this case the capture and conversion are running as one contiguous process, but it’s easy to imagine them as separate automation elements being handled through scripting by different processes. After all, we all build our Lego’s differently, don’t we?

“The Game is On!”

Post-update

Since this continues to be one of the most searched for topics, be sure to check out detonaRE, a malware detonation and capture utility that uses the same pcap functionality.

detonaRE initiates packet capture and process monitor, detonates the malware, ends pcap collection, completes evidence capture with Magnet RESPONSE. PCAP, Zip, and CSV outputs.

blog: https://bakerstreetforensics.com/2023…

GitHub: https://github.com/dwmetz/detonaRE

Magnet Weekly CTF: Week 10 Solution Walk Through

This weeks challenge was another round of memory forensics. As with the previous weeks challenge most* of my solves were done using a REMnux VM. REMnux includes both Volatility 2.61 (SSL support deprecated) and the beta of Volatility 3.

Challenge 10, Part 1: At the time of the RAM collection (20-Apr-20 23:23:26- Imageinfo) there was an established connection to a Google Server. What was the Remote IP address and port number? format: “xxx.xxx.xx.xxx:xxx”

Using the netscan plugin for Volatility and then filtering for “established” we see 4 open connections. A whois lookup on the addresses indicates that 172.253.188 is affiliated with Google. The communications were traversing port 443.

Flag 1: 172.253.63.188:443

Challenge 10, Part 2: What was the Local IP address and port number? same format as part 1

Looking at our earlier output from netscan we see the source address was 192.168.10.146:54282

Flag 2: 192.168.10.146:54282

Challenge 10, Part 3: What was the URL?

So we know we’ve got an open connection to a remote host going on at the time the memory was captured. Looking at Passive DNS for the Google IP address I could see that it’s principally been associated with Google Chat related assets.

I ran the memory sample through Bulk Extractor to carve out a PCAP of any of the networking artifacts that were present in the image.

bulk_extractor to pcap

Once the pcap was carved I opened it with Wireshark.

Looking through the pcap we see that the client computer had received a DNS response for mtalk.google.com at 172.253.63.188

The question was looking for a URL so… https://mtalk.google.com – yes! [Flag 3]. Originally this answer wasn’t accepted. I later received an email that it was accepted as an alternate solution and to resubmit.

Challenge 10, Part 4: What user was responsible for this activity based on the profile?

The getsids Volatility plugin quickly yields the active user account.

Flag 4: Warren

Challenge 10, Part 5: How long was this user looking at this browser with this version of Chrome? *format: X:XX:XX.XXXXX * Hint: down to the last second

This one had me stumped for a while. I first tried calculating the delta between when the chrome process was started to the time the image was acquired. (Nope)

Eventually I succumbed and took the hint which had to do with “FOCUS”. Another clue that I’d heard on Discord was that this was ‘VERY easy to solve in Axiom.’

Sure enough, stacking filters for Chrome and Focus and restricting the search to the Memory evidence yields a Registy artifact indicating that the focus time for Chrome was 3:36:47.301000. Oh but don’t just copy paste here without checking the question for the flag format. There’s only 5 places after the last decimal. So for Flag 5 the answer is 3:36:47.30100.

I was victorious in getting all 5 flags, but this has been just as much about learning as it has been about the friendly competition. So now that I knew the answer and where relatively it could be found in the evidence, I wanted to see if I could solve it just with REMnux as I had the other challenge elements.

I ran the timeliner Volatility plugin and exported the output file to .xlsx. format.

This took a few minutes to process. Once complete, I opened timeliner.xlsx.

Flag 5 (alternate) 3:36:47.30100

If we filter the Item column for Chrome and the Details column for Focus – there again the same result – 3:36:47.30100. Don’t forget to drop the last zero for the Flag.