The Long Game: MalChela v4.0

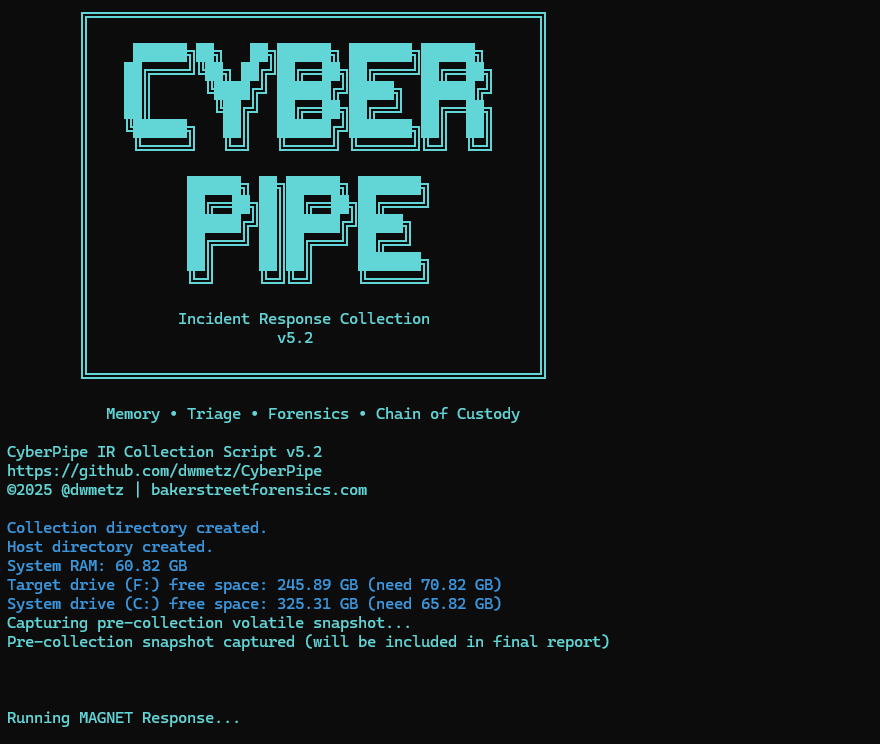
When I started building MalChela, I had a narrow problem to solve. I was doing a lot of malware triage during incident response engagements and I kept reaching for the same scattered set of tools — VirusTotal, some strings extraction, a hash lookup here, a YARA scan there. The workflow existed, but it wasn’t a workflow. It was a series of scripts and context switches dressed up as a process. I wanted something that unified those steps under one roof, ran locally, and felt like a tool a forensicator actually built.

What I got was MalChela. What I didn’t expect was how far it would go.

From Rust Experiment to Field Platform

The first version was modest. A handful of tools with a unifying CLI runner. The goal was simple: hash a malware sample, look it up, pull strings, run YARA. The kind of triage you want to do in the first ten minutes with an unknown file.

Version 2 brought a desktop GUI — MalChelaGUI, built on egui/eframe. It was a genuine step up in accessibility. Analysts who weren’t comfortable in the terminal had a way in. The toolset kept growing.

Version 3 added structure around the investigation itself. Case management landed, giving results somewhere to live across a session. MCP server integration followed, opening up a whole new mode of operation — Claude working alongside the tools, not just alongside me.

But the GUI carried freight. It meant building for a specific platform, managing a Rust GUI dependency chain, and ultimately shipping something that couldn’t easily follow MalChela into its most interesting new use case: the field.

Toby Changed Everything

If you’ve been following Baker Street Forensics for the last few months, you’ve seen the ‘TOBYgotchi‘ project take shape — a Raspberry Pi Zero 2W running Kali Linux, with a Waveshare e-ink display, PiSugar battery, and MalChela pre-installed. Boot it up, it announces itself on the network, and you’re ready to triage. And yes, I am working on making a full build of TOBY available to the public. Stay tuned…

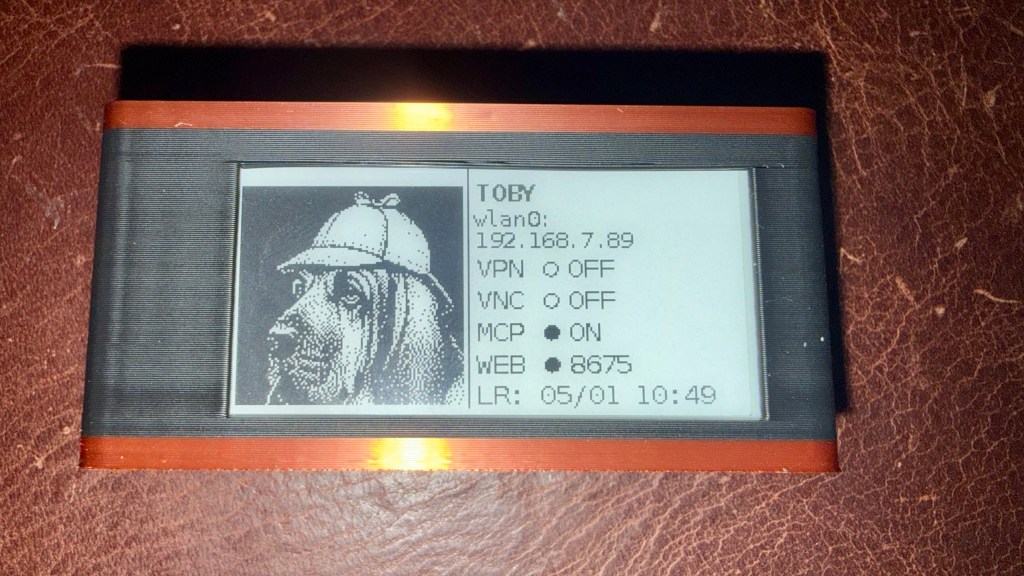
The original field kit vision was: SSH in, run tools from the CLI, pull results. Simple and functional. But the more I used Toby in practice, the more I wanted a better interface — something that worked without a terminal, something a colleague could pick up at a scene without knowing the command syntax.

MalChelaGUI on a Pi Zero 2W is possible but not comfortable. The egui overhead, the X display stack, remote display via VNC — it all works, but it’s friction. What I wanted was something lighter. Something any browser on the network could reach. Something that felt native on an iPad.

That’s what pulled me toward the PWA.

v4.0: The PWA Takes Over

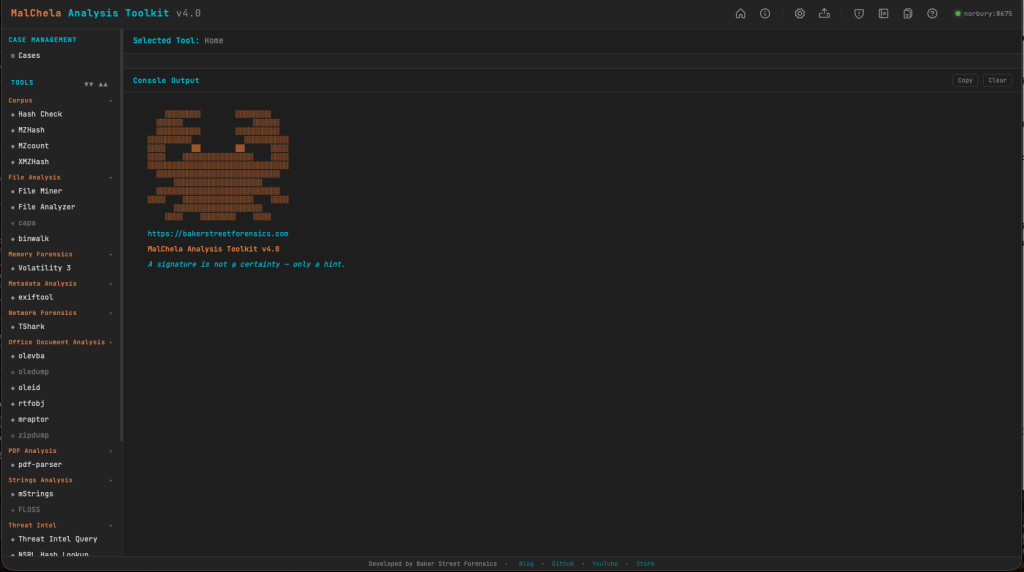
MalChela v4.0 retires the desktop GUI entirely and replaces it with a Progressive Web App as the primary interface.

Every tool that lived in MalChelaGUI has been ported. Most have been improved in the process. The PWA is served locally from the server/ directory — run setup-server.sh once after building the binaries, then start-server.sh on every subsequent boot. Open any browser on the local network and you’re in.

On Toby, this is now part of autostart. Boot the Pi — battery-powered, no cables required — and the server comes up automatically. Connect from your desktop, phone or iPad directly to the PWA. No VNC, no X display overhead, no SSH tunnel. Just a browser pointing at the Pi’s IP.

And here’s the part that makes it genuinely useful in the field: you can upload files directly from whatever device you’re browsing from to the MalChela server. Phone, iPad, laptop — if it has a browser and can reach Toby on the network, it can submit a sample for analysis. The triage station travels with you, and so does the interface.

This is still a work in progress, but the direction is clear: a battery-powered Pi you can drop on a table at a scene, pull out your tablet, and start triaging — no keyboard, no monitor, no additional hardware required.

The field kit I was imagining finally snapped into focus.

REMnux Support

Running MalChela on a REMnux instance? It’s now even easier to load the REMnux configuration tools.yaml.

Configuration > tools.yaml > Load REMnux

then refresh the browser and you’ve got access to all the REMnux CLI tools from within MalChela.

What Else Is New

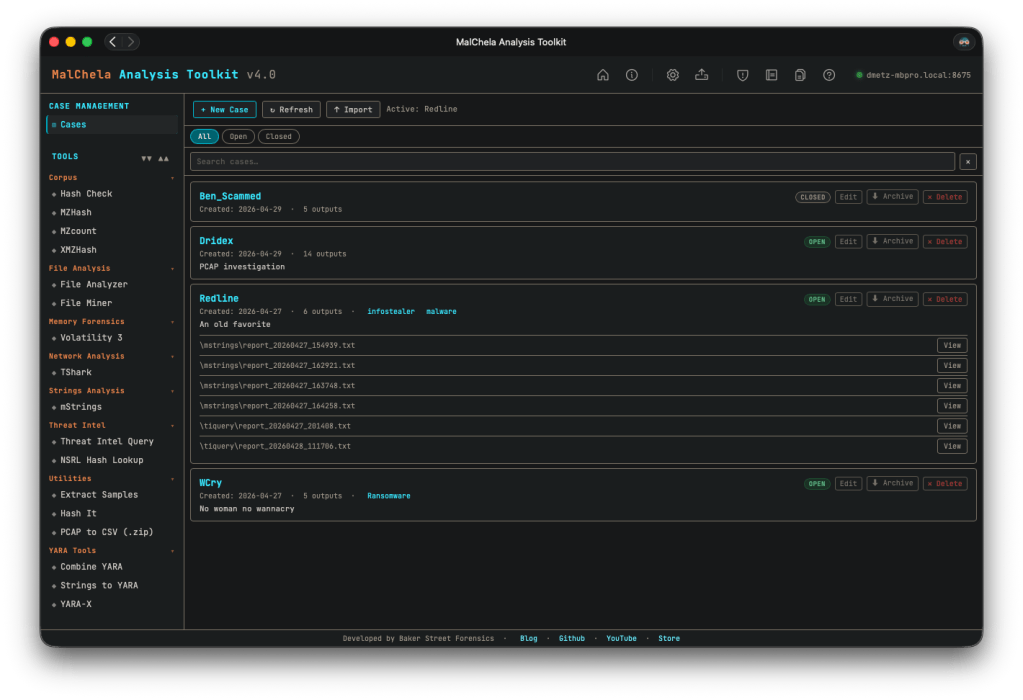
Simplified case management. This one’s been on my list for a while. In previous versions, case management was tied to starting with a file or folder — you had to know what you were investigating before you could create a case. That’s not how IR actually works. v4.0 breaks that dependency: any result can be saved to a case, and you can create a new case from within a running tool session. All the output, whether from the included cargo tools, or 3rd party add-ons like TShark or Volatility, can be saved to your case. The investigation defines the case, not the other way around.

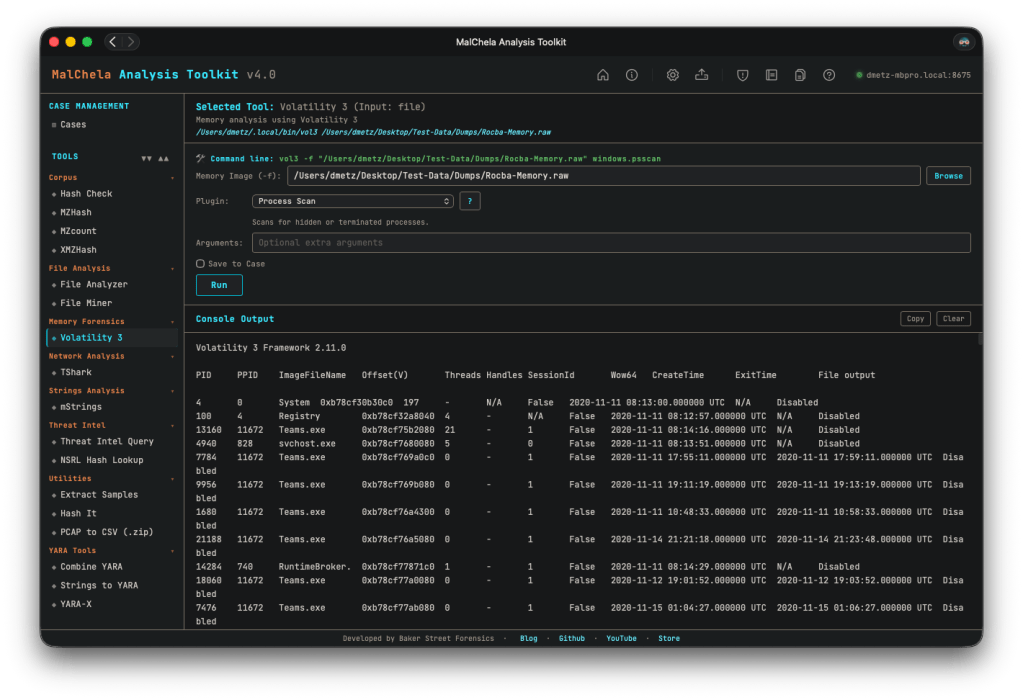
Improved Volatility support. The Volatility integration got a meaningful UX overhaul. The reference panel has been improved, and output now streams inline within the PWA — no more spawning a separate terminal window to see results, which was one of the more awkward edges of the old GUI experience.

Rapid tool iteration via tools.yaml. The PWA is built around a tools.yaml configuration file that defines the tool manifest. Add a new tool, update the YAML, refresh the interface — done. No recompiling the GUI, no rebuilding the binary for a UI change. This makes extending MalChela considerably faster in practice, and opens the door for community-contributed tool configs down the road.

Try MalChela for Yourself

MalChela v4.0 is available on GitHub now: https://github.com/dwmetz/MalChela/

The CLI isn’t going anywhere. If you’re scripting triage workflows, running MalChela headless in an automated pipeline, or just prefer the terminal, everything you relied on in v3.x is still there. The PWA is the new face of MalChela; the CLI is still the engine.

Want to run MalChela on Windows? You can build it in an Ubuntu instance in WSL. Once you start the server in WSL, the Windows host can access the PWA via http://localhost:8675. (In modern WSL2 Microsoft automatically forwards WSL loopback → Windows localhost.)

If you hit any constraints, open an issue on GitHub. I tried to be as thorough as possible in my testing, but there’s only so much a one-man dev team can do. I’m happy assist in troubleshooting and improve the documentation. Rest assured you won’t get a “well, it works in my environment…”

The Game Is Afoot: Introducing the MalChela Video Series

There’s a moment every analyst knows — the one where an unknown file lands on your desk and the clock starts ticking. You need answers, and you need them fast. MalChela was built for exactly that moment.

Today I’m excited to announce the MalChela Video Series on YouTube — a growing collection of tutorial episodes walking through real malware analysis workflows using MalChela, the open-source Rust-based toolkit I’ve been building for the DFIR community. Whether you’re new to the tool or already running it in your lab, there’s something here for you.

Four episodes are available right now in the playlist.


What’s in the Playlist

Ep0 | Installation & First Run

Every case starts somewhere. Episode 0 is your onboarding — installing MalChela, walking through its dependencies, and getting oriented with both the CLI and GUI modes. If you’ve been curious about the tool but weren’t sure where to start, this is the episode to bookmark.


Ep1 | First Contact: Hash, Inspect, Identify

You’ve just been handed a suspicious file. What do you do first?

This episode covers the first three tools in a malware triage workflow — the exact sequence I reach for every time I encounter an unknown file:

  • hashit — generate MD5, SHA1, and SHA256 hashes to protect chain of custody and enable deduplication
  • fileanalyzer — static inspection: entropy analysis, PE header fields, compile timestamps, and import tables
  • malhash — simultaneous lookup against VirusTotal and MalwareBazaar to identify known malware families

By the end of this episode, you’ll take an unknown file from zero to confirmed malware family identification in under five minutes — no sandboxing required.


Ep2 | From Strings to Signatures

Continuing from Episode 1, we go deeper into the confirmed RedLine info-stealer sample using mStrings — MalChela’s string extraction engine. Unlike the traditional strings utility, mStrings runs every extracted string through a detection ruleset and MITRE ATT&CK mapping layer simultaneously, turning raw output into actionable intelligence.

We walk through 62 detections, including PDB path artifacts, hard-coded dropper filenames, WMI queries, credential harvesting patterns, anti-debug checks, and a code injection setup. We then feed the extracted IOCs into Strings2YARA to auto-generate a structured YARA rule — and confirm it fires against the sample using File Analyzer.

By the end, you’ll be reading a malware file not as a pile of strings, but as a window into the attacker’s tradecraft.


Ep3 | REMnux Mode & Custom Tools

MalChela doesn’t work in isolation. Episode 3 covers how to extend the toolkit through the tools.yaml config file and how enabling REMnux mode surfaces an entire distro’s worth of malware analysis utilities directly within MalChela’s interface.

We also explore three built-in integrations: Volatility 3 with a dynamic plugin builder, T-Shark with a searchable reference, and YARA-X — a faster, Rust-native rewrite of YARA.


What’s Coming

The series is ongoing. Future episodes will push further into advanced workflows — think directory-scale triage, corpus management, and the AI-assisted analysis capabilities introduced in MalChela’s MCP integration. Stay subscribed and you won’t miss them.


Get Involved

If MalChela is useful in your work, the best thing you can do is help spread the word:

  • 📺 Subscribe to the YouTube channel — Subscribe to the channel and save the playlist so you don’t miss new episodes as they land.
  • 📖 Follow Baker Street Forensics — Writeups, major releases, and workflow deep dives live here.
  • 💬 Share and comment — If an episode clicks for you, pass it along to a colleague or drop a comment on the video. That feedback genuinely shapes what comes next.

The game is afoot. Let’s get to work.


MalChela is open-source and freely available. Find the project on GitHub.

CyberPipe v5.3: Enhanced PowerShell Compatibility and Reliability

I’m pleased to announce the release of CyberPipe v5.3, bringing critical compatibility improvements for Windows PowerShell 5.1 and enhanced reliability across all PowerShell environments.

The Problem

After releasing v5.2 with the new unified banner design, several users reported an interesting issue: CyberPipe would execute perfectly in PowerShell Core, but in Windows PowerShell 5.1, the script would complete the Magnet Response collection successfully—then immediately fail with an exit code error and stop before running EDD and BitLocker key recovery.

The collected artifacts were there. The output looked successful. But the script refused to continue.

The Root Cause

This turned out to be a known quirk in Windows PowerShell 5.1: the $process.ExitCode property isn’t always reliably populated after calling WaitForExit() on a process object. Even when Magnet Response completed successfully with exit code 0, PowerShell 5.1 would sometimes report a non-zero value, causing CyberPipe to think the collection had failed.

The Solution

Version 5.3 introduces dual validation logic that checks both the exit code and verifies that files were actually collected. If Magnet Response reports a non-zero exit code but artifacts were successfully collected, CyberPipe recognizes this as a PS 5.1 reporting issue and continues the workflow with a warning message.

The script now validates success based on what actually matters: did we collect the evidence?

Bonus: Adaptive Banners

While fixing the PS 5.1 compatibility, I also enhanced the banner display:

  • PowerShell Core: Displays the full Unicode box-drawing banner with visual flair
  • Windows PowerShell 5.1: Shows a clean ASCII banner optimized for automation, EDR deployment, and environments where Unicode rendering may be inconsistent

The script automatically detects which PowerShell edition is running and adjusts accordingly.

Testing & Validation

CyberPipe v5.3 has been tested and verified on:

  • ✅ Windows PowerShell 5.1
  • ✅ PowerShell Core 7.x
  • ✅ All collection profiles (Volatile, RAMOnly, RAMPage, RAMSystem, QuickTriage, Full)

The script now executes flawlessly in both environments with no workflow interruptions.

Compatibility Notes

This is a drop-in replacement for v5.2 with no breaking changes:

  • All command-line parameters work identically
  • Existing automation scripts require no modifications
  • All collection profiles function as before

Why This Matters

For incident response work, reliability is non-negotiable. When you’re collecting evidence from a potentially compromised system, you need tools that work consistently across different Windows environments—corporate workstations running PS 5.1, modern systems with PS Core, virtual machines, and physical hardware.

CyberPipe v5.3 ensures that whether you’re running an interactive collection or deploying via EDR automation, the script executes reliably from start to finish.

Get CyberPipe v5.3

DownloadCyberPipe v5.3 on GitHub

DocumentationGitHub Repository

As always, feedback and issue reports are welcome on the GitHub repository.


CyberPipe is a free, open-source incident response collection tool for Windows systems, automating memory capture, triage collection, encrypted disk detection, and BitLocker key recovery.

Streamline Digital Evidence Collection with CyberPipe 5.2

I first wrote CyberPipe when I was on the front lines of incident response, driven by the need for more robust and efficient triage collections, whether online or off.  Over the years, CyberPipe continues to adapt and improve, addressing the ever-changing challenges faced by incident response practitioners. 

CyberPipe (formerly CSIRT-Collect) is a PowerShell script that is designed to streamline the collection of digital evidence using Magnet Response in enterprise environments, ensuring that responders can gather critical data efficiently and effectively.  Other features include detection of encrypted drives, BitLocker key recovery, and memory image collection.

The most recent update includes enhancements in three areas: Collection, Capabilities, and Reliability.

Screenshot of CyberPipe

🔍 What’s New in 5.2

Intelligent Collection

  • The script now includes dual disk space validation, checking both the target drive and the system drive with profile-aware thresholds to prevent sudden failures due to insufficient space. 
  • A pre-collection volatile snapshot captures uptime, users, connections, and processes to preserve transient state before heavy operations begin.
  • Reports virtual environment detection (VMware, Hyper-V, VirtualBox, etc.) to help analysts understand collection limitations.
  • Real-time progress indicators provide accurate size tracking during the collection, offering responders visibility into the remaining data capture.

Enhanced Capabilities

  • The new QuickTriage profile allows for rapid collection of volatile and system artifacts when time is ticking.
  • BitLocker recovery now includes all volumes, not just the C: drive.
  • A single-file report (CyberPipe-Report.txt) consolidates metadata and a summary of collected artifacts in a human-readable format.
  • All collected artifacts and logs are hashed using SHA-256 to enhance integrity and chain of custody.
  • Output compression is available via the -Compress flag, aiding in storage and transfer.
  • Network collection is simplified with the -Net parameter, eliminating the need for manual network path or configuration edits.

Improved Reliability

  • Profile-aware space checks alert when free space is insufficient for a chosen profile, preventing silent failures.
  • The script now validates exit codes from MAGNET Response to detect failures more effectively.
  • Artifact verification after collection ensures that all expected items were gathered.
  • Error handling and messaging have been refined to provide clearer feedback to the operator.

What I’m hoping this delivers

CyberPipe 5.2 aims to address some challenges observed in real-world triage and live-response operations:

  • Resilience in constrained environments — dual drive checks and profile awareness help prevent mid-collection failures.
  • Better transparency and oversight — real-time progress display and post-collection verification enhance confidence.
  • Faster response options — the QuickTriage profile is suitable when speed is paramount.
  • Stronger forensic hygiene — SHA-256 hashing, improved error detection, and full-volume BitLocker key recovery contribute to defensibility.
  • Easier network deployments — built-in ‘-Net‘ support facilitates smoother remote collection.

As always, CyberPipe is freely available at https://github.com/dwmetz/CyberPipe. Forks and Contributions welcome and appreciated. 

Is there a feature you’d like to see? I think next I might work on support for copying output to AWS/Azure. Thoughts?