MalChela v4.3

Hot on the heels of v4.2… yep, v4.3. What can I say? The melatonin isn’t cutting it anymore to keep me asleep. Rather than count sheep – working on my favorite project helps. Granted I’ve still got bags under my eyes, but I’ve got something to show for it.

At A Glance

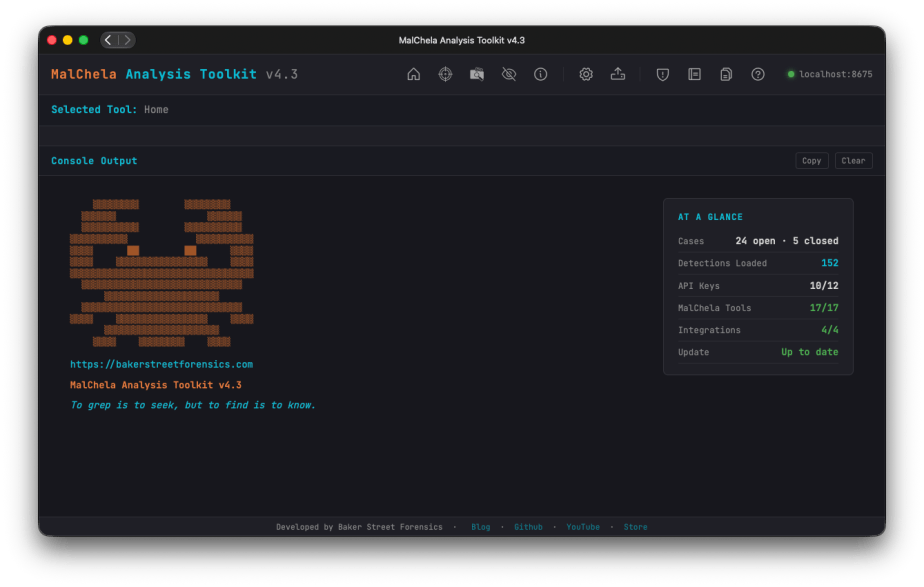
The first thing you’ll notice on this release, after all it’s impossible to miss, the At A Glance panel added to the Home Screen. In addition to the “Crabby Koans“, you see:
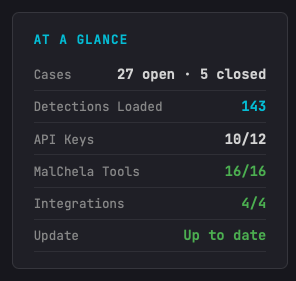
  • Number of open/closed cases
  • API key status
  • Number of MalChela tools loaded
  • Number of Integrations (3rd party tools) loaded; great for REMnux mode
  • GitHub status for available updates (it’s back!)

Other UI enhancements include new Analyze and Cases toolbar buttons, a collapsible Tools sidebar; and live progress updates during a run.

Airplane Mode / Offline Mode

While there’s a lot of great threat-intel information you can garner using TIQuery and the other utilities, sometimes internet isn’t an option – or maybe it’s a sample you want to handle so carefully you want to ensure there’s no external lookup activity. MalChela won’t mess with your Op-Sec. Rather than just have things fail gracefully (hopefully) when there’s no internet, there’s now a new Offline Mode toggle (Configuration screen), that cleanly skips every network call across the toolkit (NSRLQuery, TIQuery’s full multi-source lookup, FileAnalyzer’s VirusTotal + NSRL checks) instead of failing quietly or hanging, so labs and scenarios can run fully air-gapped.

Analyze Rollup

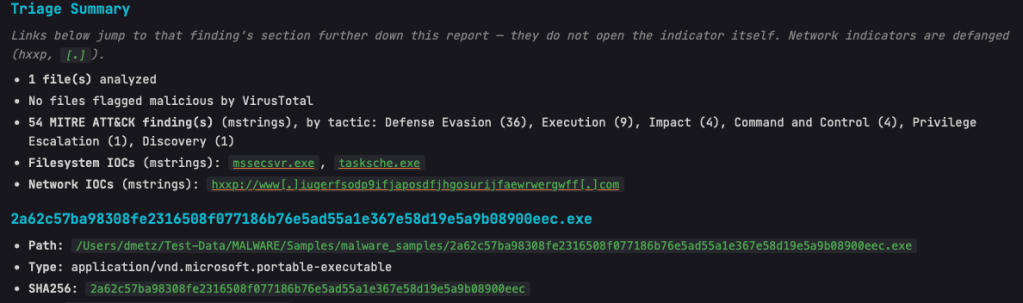
  • Triage Summary now links directly to the relevant section for flagged malicious files and their flags/indicators, plus the Filesystem and Network IOC lists — click a finding, jump straight to the detail.
  • Network IOCs in the rollup are shown defanged by default, with a note clarifying that links jump to the report section rather than the live URL.
  • Case ZIP/archive samples and containers found mid-scan (not just top-level) are now auto-extracted and analyzed automatically.
  • Includes the new dpp Extract tool: unwraps DMG/PKG containers to reach the real payload files inside.
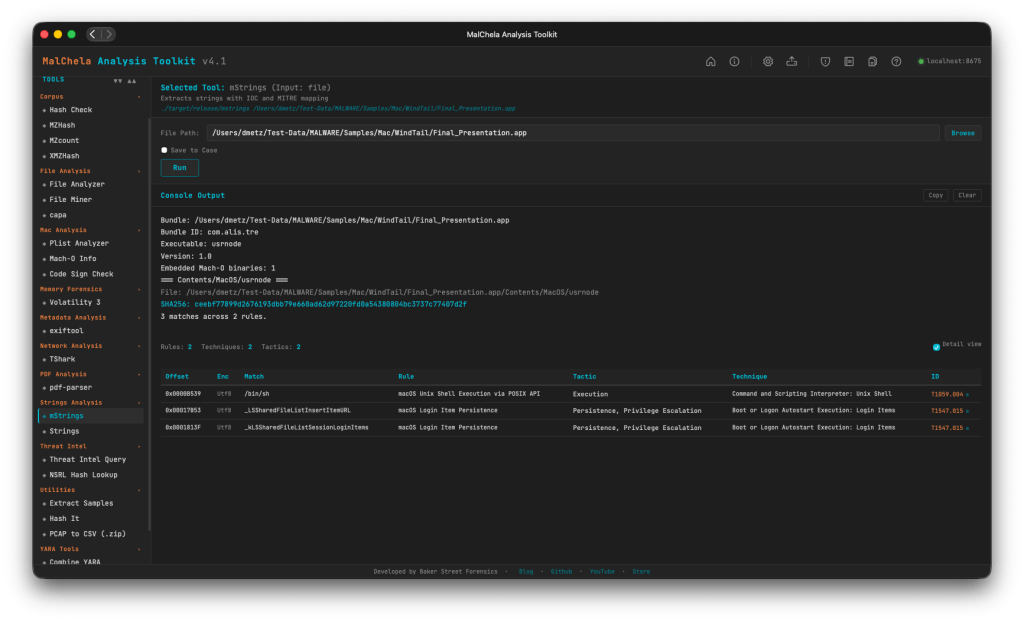
mStrings

As the tools and the suite continue to grow, mStrings remains the star of the show. Updates in this release include:

  • Network IOCs in mStrings’ own report output are now defanged, matching the rollup.
  • Base64 strings are now auto-decoded and recursively rescanned for further IOCs/detections.
  • Regex engine switched to fancy-regex, enabling lookaround-based detection patterns.
  • Better surfacing of bare-domain C2 IOCs and multi-layer obfuscation depth.
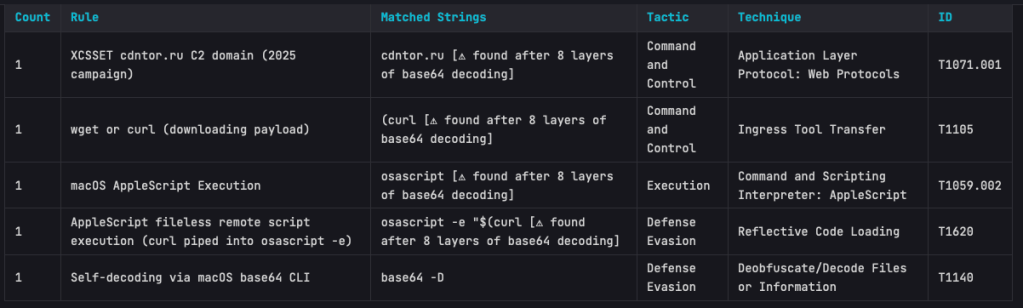
The Base64 scanning is impressive. On one of my test samples MalChela was able to extract strings in a file buried under 8 layers of Base64 encapsulation.

StringsToYARA

  • New refang capability: defanged URLs (hxxp://, [.]) in source strings are automatically restored to real URLs in the generated YARA rule.

Safely store your URLs in a defanged state – when it’s time to create the rule – then and only then does the live url get exposed.

Detections

  • 25 new detection rules added (bringing the ruleset to 144), including full coverage for the Proton macOS RAT family, XCSSET, iWorm, EmPyre, Bella RAT, BirdMiner, and Python self-decompressing execution patterns.

Documentation

  • Full documentation pass covering all of the above, plus a new Offline Mode reference page and a Top Toolbar quick-reference table.
  • Bonus for me, the PDF User Guide is now generated via an automated, versioned build pipeline.
MalChela 4.2 Release

I’m excited to announce that v4.2 of MalChela is now available. While it may not be “the Answer to the Ultimate Question of Life, the Universe, and Everything,” or even The Malware Analysts Guide to the Galaxy, it does have some great new functionality.

This release has two big themes. First, the Mac side of the house — four tools now speak fluent .app bundle instead of making you dig out the binary inside Contents/MacOS/ yourself.

Second, and bigger: there’s a new way to run MalChela that doesn’t start with “which tool do I need for this file again?” It’s called Analyze, and it’s the closest thing this project has had to a an easy button.

Mac app bundle support (“Mac Stack”)

If you’ve ever pulled a .app bundle into MalChela before, you know the drill: find the actual binary buried in Contents/MacOS/, feed that to whatever tool you’re running, and hope you resolved the right one. That workaround is gone. Four tools now understand .app bundles directly — point macho_info, codesign_check, mstrings, or plist_analyzer at the bundle itself and they auto-resolve the main executable (via CFBundleExecutable, falling back to the sole binary in Contents/MacOS/ when needed).

What each one is actually looking for:

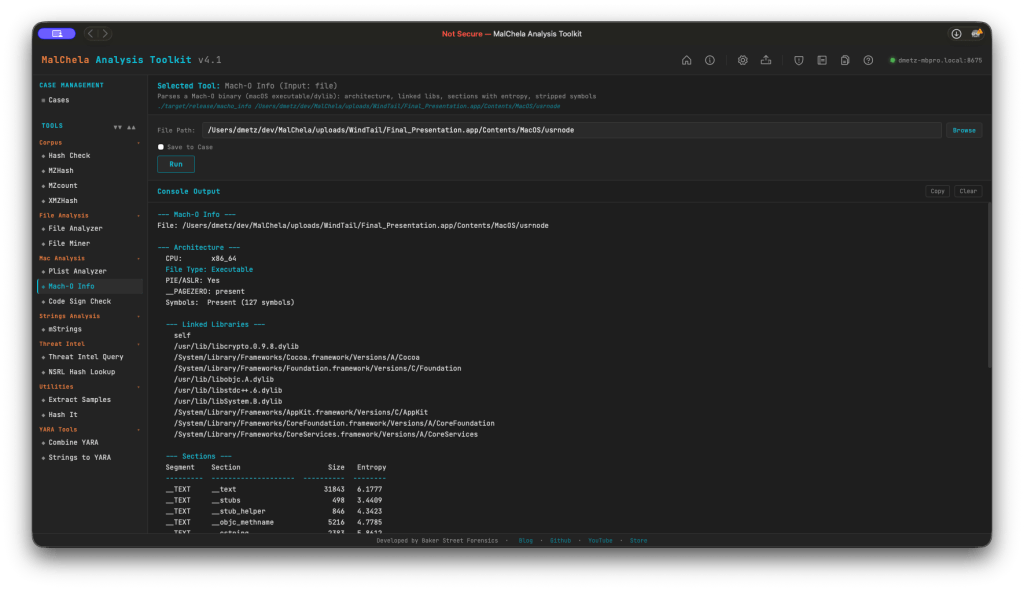
  • macho_info — architecture, PIE/ASLR, __PAGEZERO, linked libraries, per-section entropy. It flags deprecated/EOL crypto libraries, RPATH entries (a classic dylib-hijacking setup), and the CoreFoundation+SystemConfiguration+Security dylib triad that shows up disproportionately often in C2 implants.
  • codesign_check — signature status (Developer-signed / Ad-hoc / Unsigned), Bundle ID, Team ID, entitlements, and the get-task-allow flag (a tell for debug builds). It also catches Team ID mismatches between a bundle’s signer and its main executable’s signer — a supply-chain / hijack indicator that’s easy to miss by eye.
  • plist_analyzer — flags LSUIElement/NSUIElement (an app hiding itself from the Dock), NSAllowsArbitraryLoads (App Transport Security turned off), custom CFBunda missing CFBundleSignature, and missing orextra binaries inside Contents/MacOS/.
  • mstrings — now scans Mach-O binaries and bundles directly, with the same bundle-to-executable auto-resolution as the rest of the stack.

More Mac-specific detections are already in the pipeline for upcoming releases, so consider this the foundation, not the ceiling.

Analyze — one-click auto-triage

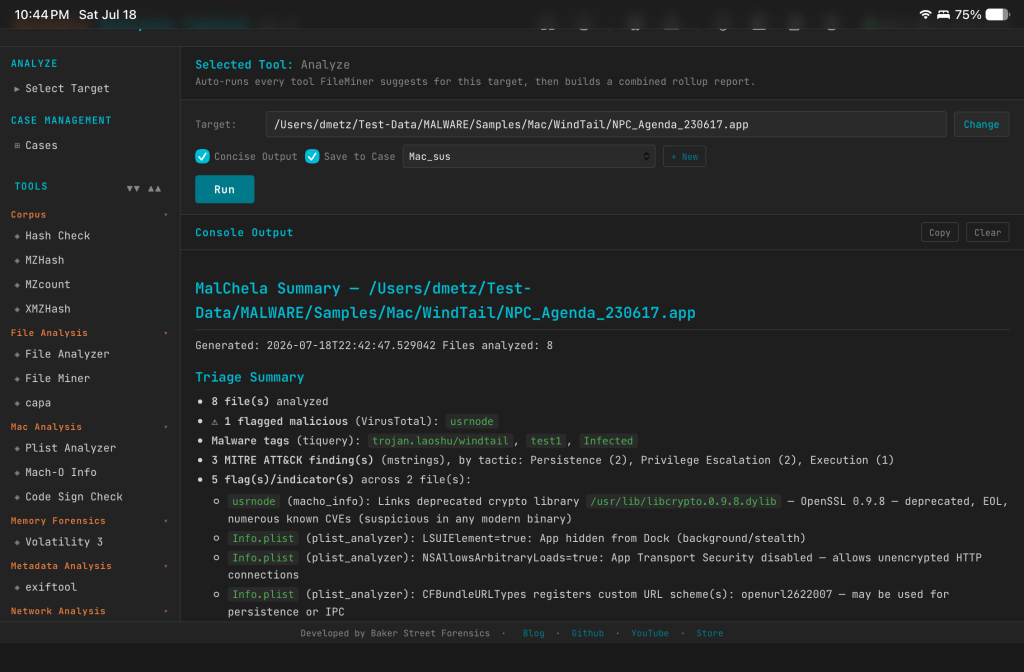
Point Analyze at a file, a folder, or a .app bundle, and it classifies everything with FileMiner, then automatically dispatches every tool FileMiner suggests for each file it finds. No more running FileMiner, reading the suggested-tools column, and manually kicking off each one yourself — Analyze closes that loop for you. It’s available in both the PWA and as a new analyze tool in the MCP server, so if you’re driving MalChela through Claude, the same triage workflow is one call away.

A couple of details worth knowing:

  • Save to Case works exactly like every other tool panel — checkbox plus case dropdown, opt-in. On the MCP side, it follows the same rule as every other MCP tool: you need an active case (set_case) before Analyze will run, which keeps the behavior consistent across the whole server rather than special-casing this one workflow.
  • Concise Output is on by default and renders the rollup report inline instead of the full expanded per-tool output — good default for a first pass, and easy to turn off if you want to see everything each tool produced.

The MalChela Summary rollup report

Every Analyze run produces one malchela_summary_<timestamp>.md, saved alongside the individual tool reports it’s summarizing. The goal here wasn’t just “concatenate the output” — it’s a real triage document, and it leads with a summary banner built to answer the questions you’d actually ask first:

  • How many files, really? File counts, with automatic grouping of duplicate content — if the same bytes show up under five different filenames (extremely common with carved or exported artifacts), you get one write-up instead of five identical ones.
  • Is anything flagged? Malicious verdicts pulled from VirusTotal, cross-referenced across both FileAnalyzer and tiquery — which matters more than it sounds like, since FileAnalyzer isn’t run against Mach-O files, so tiquery is what keeps Mac samples from falling through the cracks.
  • What is it? Malware family and tag names pulled straight from tiquery’s multi-source lookups.
  • What does it do? MITRE ATT&CK findings from mstrings, totaled and broken down by tactic, so you can see at a glance whether you’re looking at something built for persistence, defense evasion, discovery, or all of the above.
  • What did it touch or talk to? Filesystem and network IOCs surfaced by mstrings.
  • What’s structurally off? Flags and indicators from macho_info, plist_analyzer, and codesign_check — the RPATH entries, hidden-Dock plists, and Team ID mismatches mentioned above, all rolled up in one place.

Below the summary, each file gets its own section with every tool’s actual formatted report embedded — real tables, real headers, not a wall of raw console output. It reads cleanly whether you’re looking at it in the PWA or opening the file on its own.

Douglas Adams never actually tells us what the Question is — just the Answer. v4.2 doesn’t have that problem. The question was always “what’s actually in this sample,” and now Analyze, the Mac Stack, and the MalChela Summary answer it in one pass instead of five.

Pull the release, point Analyze at something, and see what the rollup finds. Don’t forget your towel. https://github.com/dwmetz/MalChela/releases/tag/v4.2

MalChela v4.1: Mac Malware Analysis Arrives

MalChela v4.1 is out today, and the headline is something I’ve been wanting to tackle for a while: dedicated Mac malware analysis tooling. If you’ve been following the channel or the blog, you know MalChela started as a triage-first toolkit aimed at the kinds of samples that show up in Windows-centric IR engagements. That coverage was never the full picture. Mac malware — infostealers, adware loaders, APT implants — has become too common to treat as an edge case. v4.1 is the start at addressing that directly.


New Tools: Mac Analysis

Three new tools land in this release, each targeting a different layer of Mac binary analysis. All three are available in the PWA under the Mac Analysis heading, accessible via CLI shortcodes, and included in the release scripts.

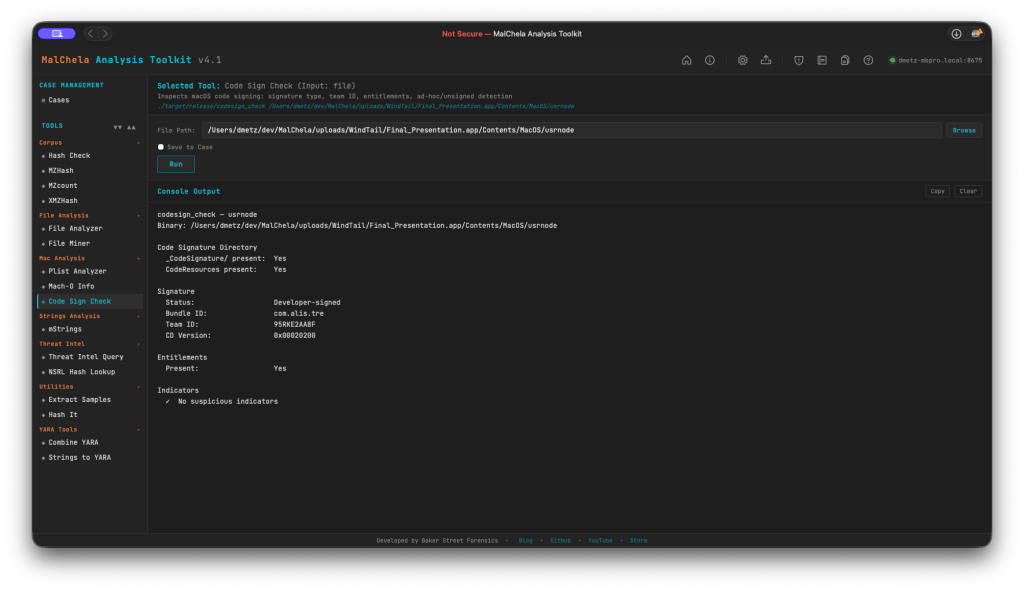
codesign_check (cs)

macOS code signatures are one of the first things worth checking on any suspicious binary. codesign_check accepts either an .app bundle or a bare Mach-O and reports signature status (Developer-signed, Ad-hoc, or Unsigned), Bundle ID, Team ID, and entitlement presence — including the get-task-allow flag that marks debug and development builds. It also verifies the _CodeSignature/ and CodeResources directory structure.

Indicators flagged: missing CMS blob, CS_ADHOC flag, absent Team ID, and get-task-allow entitlement. FileMiner now suggests Code Sign Check automatically for all Mach-O files in a scan. (Planned feature: adding a certificate revocation check).

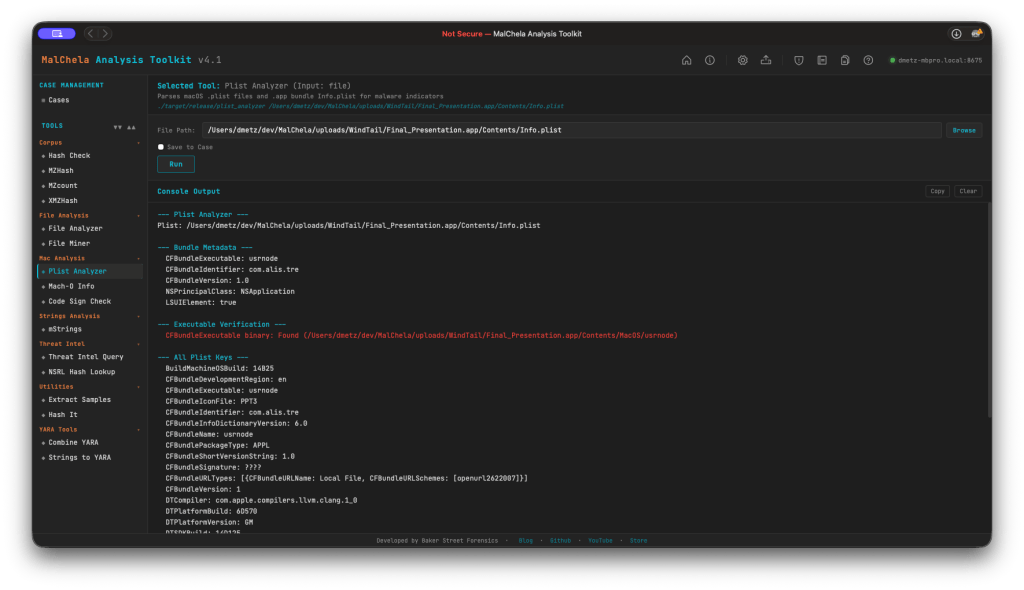
plist_analyzer (pa)

Parses macOS .plist files and .app bundle Info.plist for static malware indicators. This release includes four new detections:

  • LSUIElement / NSUIElement = true — app runs as a hidden background agent with no Dock icon. Both the modern LSUIElement and legacy NSUIElement (integer 1) forms are now detected, covering older macOS malware that used the pre-Sierra key.
  • NSAllowsArbitraryLoads = true — App Transport Security disabled, a classic C2 channel indicator.
  • CFBundleURLTypes with custom URL schemes — flags non-standard scheme registrations used for persistence or inter-process communication.
  • CFBundleSignature = ‘????’ — no creator code set, common in unsigned tools and malware.

macho_info (mo)

Parses thin and fat/universal Mach-O binaries and reports: architecture, linked libraries, section entropy, symbol status, RPATH entries, __PAGEZERO integrity, and PIE/ASLR flags.

This release also adds deprecated crypto library detection: macho_info now flags linkage against end-of-life OpenSSL libraries (libcrypto.0.9.8libssl.0.9.8, and variants). There’s no legitimate reason for a modern binary to link these — flag it and investigate further.


mStrings — Mac Tuning

Running mStrings against Mach-O binaries previously produced a lot of noise: ObjC runtime stubs, Swift mangled symbols, and Apple system library paths that add volume without adding signal. A new is_objc_swift_noise() filter suppresses these categories:

  • _objc_* runtime stubs
  • @_* import stubs (including @_LSSharedFileList*, which was previously surfacing as false-positive filesystem IOCs)
  • Swift mangled symbols (_$s*_T0swift_*)
  • Apple system dylib paths under /System/Library/Frameworks/ and /usr/lib/swift/
  • ObjC type encoding strings

Alongside the noise filter, 12 new Mac-specific MITRE detection rules have been added to detections.yaml:

RuleTechnique
MacLaunchAgentDaemonPersistenceT1543.001
MacLoginItemPersistenceT1547.015
MacShellProfileInjectionT1546.004
MacCronJobPersistenceT1053.003
MacDylibInjectionT1574.006
MacKeychainAccessT1555.001
MacAppleScriptExecutionT1059.002
MacUnixShellExecutionT1059.004
MacPrivilegeEscalationT1548.004
MacSystemDiscoveryT1082
MacSandboxVMEvasionT1497.001
MacSensitiveFileAccessT1005

Mac path extraction also gets a dedicated regex: re_mac_path captures filesystem IOCs in Mac-style paths (.sh.py.dylib.plist.app.pkg.command) under /Users//Library//tmp/, and related directories.


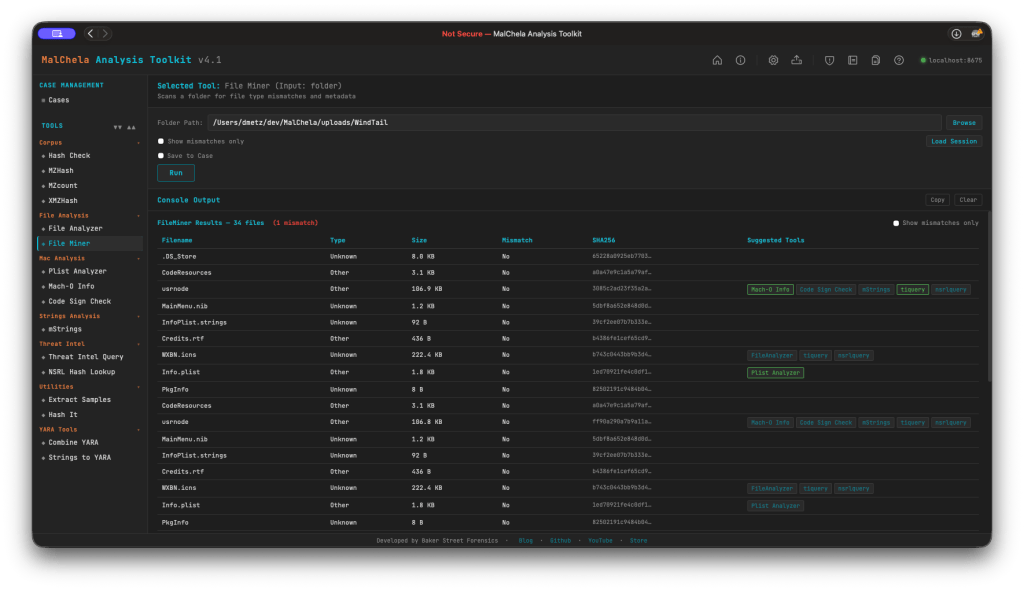
FileMiner — Session Persistence

FileMiner scan results now persist across browser close and refresh. Results, the analyzed path, and the set of executed sub-tools survive in localStorage automatically. On each scan, a session.json is also written server-side to saved_output/fileminer/ — or to the active case folder under saved_output/cases/<case>/fileminer/ when Save to Case is checked.

Load Session button in the FileMiner options bar opens a file browser pre-navigated to the correct session directory. Selecting a session.json restores the full results table and re-populates the path input. Like the previous GUI, fileminer now tracks tool runs for suggested tools (green indicates tool report already generated).

MalChela v4.1 is available now on GitHub. As I said this is just the start of the macOS malware support. I’m looking forward to taking this much further.

The Long Game: MalChela v4.0

When I started building MalChela, I had a narrow problem to solve. I was doing a lot of malware triage during incident response engagements and I kept reaching for the same scattered set of tools — VirusTotal, some strings extraction, a hash lookup here, a YARA scan there. The workflow existed, but it wasn’t a workflow. It was a series of scripts and context switches dressed up as a process. I wanted something that unified those steps under one roof, ran locally, and felt like a tool a forensicator actually built.

What I got was MalChela. What I didn’t expect was how far it would go.

From Rust Experiment to Field Platform

The first version was modest. A handful of tools with a unifying CLI runner. The goal was simple: hash a malware sample, look it up, pull strings, run YARA. The kind of triage you want to do in the first ten minutes with an unknown file.

Version 2 brought a desktop GUI — MalChelaGUI, built on egui/eframe. It was a genuine step up in accessibility. Analysts who weren’t comfortable in the terminal had a way in. The toolset kept growing.

Version 3 added structure around the investigation itself. Case management landed, giving results somewhere to live across a session. MCP server integration followed, opening up a whole new mode of operation — Claude working alongside the tools, not just alongside me.

But the GUI carried freight. It meant building for a specific platform, managing a Rust GUI dependency chain, and ultimately shipping something that couldn’t easily follow MalChela into its most interesting new use case: the field.

Toby Changed Everything

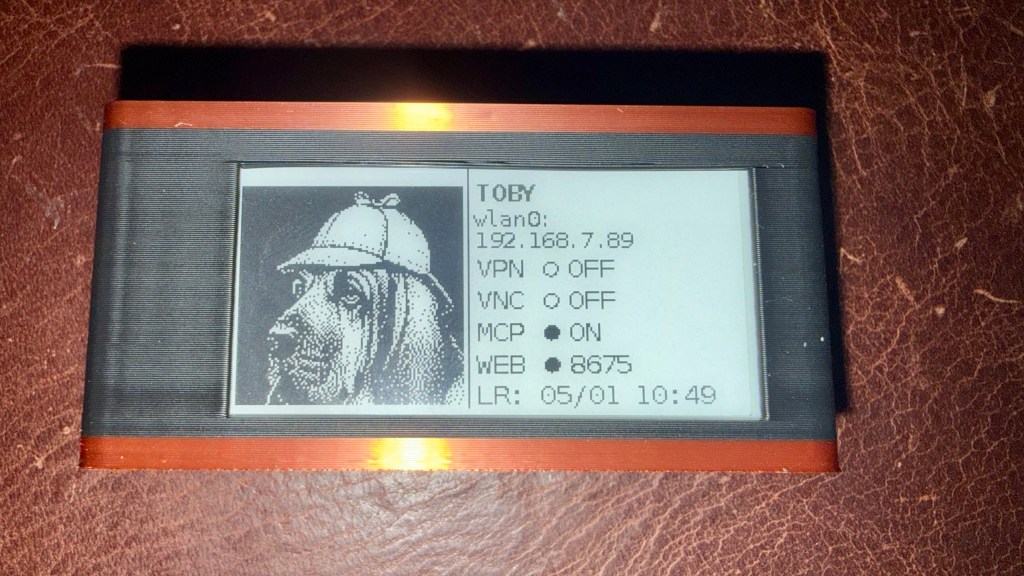
If you’ve been following Baker Street Forensics for the last few months, you’ve seen the ‘TOBYgotchi‘ project take shape — a Raspberry Pi Zero 2W running Kali Linux, with a Waveshare e-ink display, PiSugar battery, and MalChela pre-installed. Boot it up, it announces itself on the network, and you’re ready to triage. And yes, I am working on making a full build of TOBY available to the public. Stay tuned…

The original field kit vision was: SSH in, run tools from the CLI, pull results. Simple and functional. But the more I used Toby in practice, the more I wanted a better interface — something that worked without a terminal, something a colleague could pick up at a scene without knowing the command syntax.

MalChelaGUI on a Pi Zero 2W is possible but not comfortable. The egui overhead, the X display stack, remote display via VNC — it all works, but it’s friction. What I wanted was something lighter. Something any browser on the network could reach. Something that felt native on an iPad.

That’s what pulled me toward the PWA.

v4.0: The PWA Takes Over

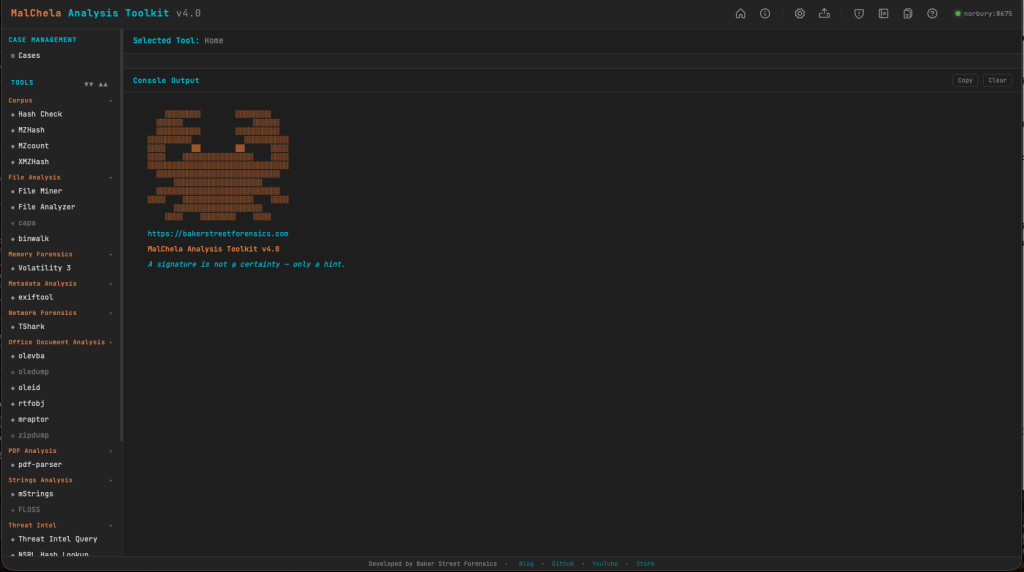
MalChela v4.0 retires the desktop GUI entirely and replaces it with a Progressive Web App as the primary interface.

Every tool that lived in MalChelaGUI has been ported. Most have been improved in the process. The PWA is served locally from the server/ directory — run setup-server.sh once after building the binaries, then start-server.sh on every subsequent boot. Open any browser on the local network and you’re in.

On Toby, this is now part of autostart. Boot the Pi — battery-powered, no cables required — and the server comes up automatically. Connect from your desktop, phone or iPad directly to the PWA. No VNC, no X display overhead, no SSH tunnel. Just a browser pointing at the Pi’s IP.

And here’s the part that makes it genuinely useful in the field: you can upload files directly from whatever device you’re browsing from to the MalChela server. Phone, iPad, laptop — if it has a browser and can reach Toby on the network, it can submit a sample for analysis. The triage station travels with you, and so does the interface.

This is still a work in progress, but the direction is clear: a battery-powered Pi you can drop on a table at a scene, pull out your tablet, and start triaging — no keyboard, no monitor, no additional hardware required.

The field kit I was imagining finally snapped into focus.

REMnux Support

Running MalChela on a REMnux instance? It’s now even easier to load the REMnux configuration tools.yaml.

Configuration > tools.yaml > Load REMnux

then refresh the browser and you’ve got access to all the REMnux CLI tools from within MalChela.

What Else Is New

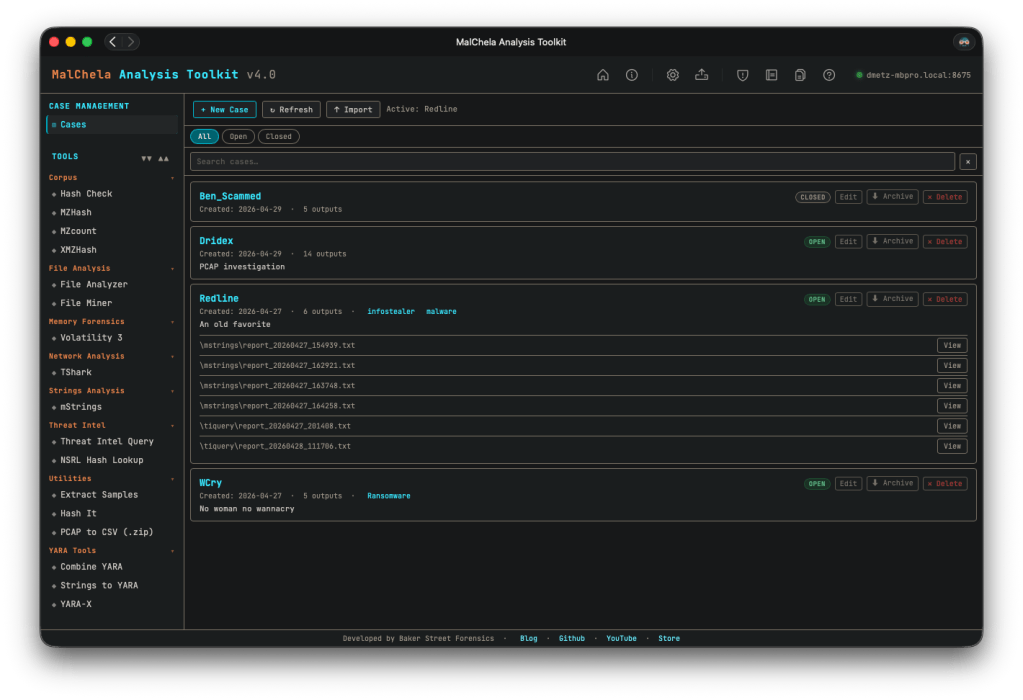
Simplified case management. This one’s been on my list for a while. In previous versions, case management was tied to starting with a file or folder — you had to know what you were investigating before you could create a case. That’s not how IR actually works. v4.0 breaks that dependency: any result can be saved to a case, and you can create a new case from within a running tool session. All the output, whether from the included cargo tools, or 3rd party add-ons like TShark or Volatility, can be saved to your case. The investigation defines the case, not the other way around.

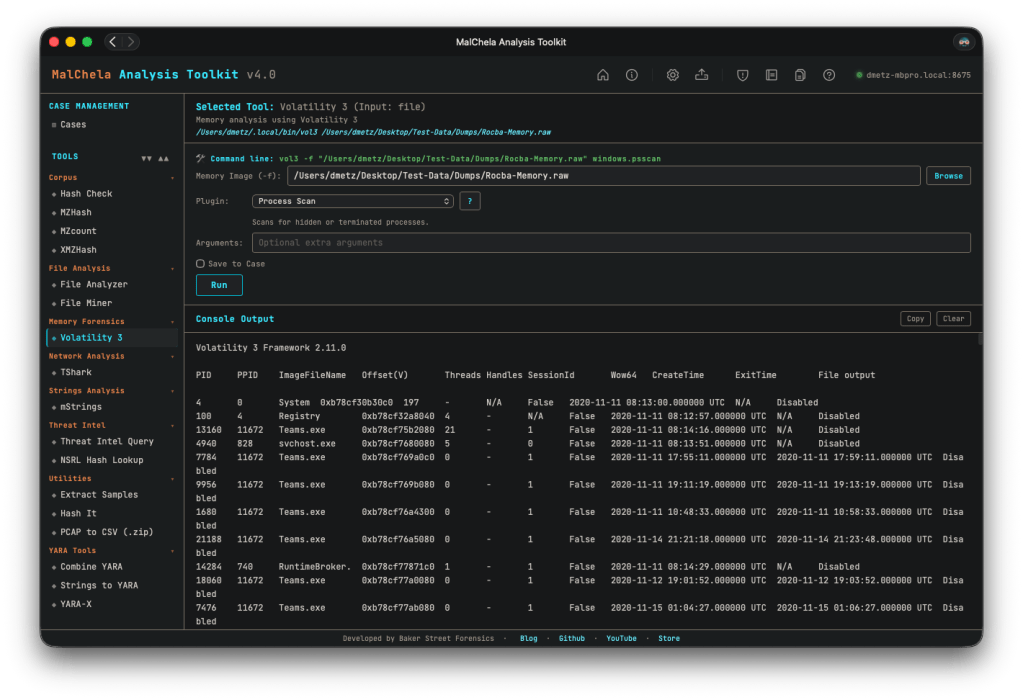
Improved Volatility support. The Volatility integration got a meaningful UX overhaul. The reference panel has been improved, and output now streams inline within the PWA — no more spawning a separate terminal window to see results, which was one of the more awkward edges of the old GUI experience.

Rapid tool iteration via tools.yaml. The PWA is built around a tools.yaml configuration file that defines the tool manifest. Add a new tool, update the YAML, refresh the interface — done. No recompiling the GUI, no rebuilding the binary for a UI change. This makes extending MalChela considerably faster in practice, and opens the door for community-contributed tool configs down the road.

Try MalChela for Yourself

MalChela v4.0 is available on GitHub now: https://github.com/dwmetz/MalChela/

The CLI isn’t going anywhere. If you’re scripting triage workflows, running MalChela headless in an automated pipeline, or just prefer the terminal, everything you relied on in v3.x is still there. The PWA is the new face of MalChela; the CLI is still the engine.

Want to run MalChela on Windows? You can build it in an Ubuntu instance in WSL. Once you start the server in WSL, the Windows host can access the PWA via http://localhost:8675. (In modern WSL2 Microsoft automatically forwards WSL loopback → Windows localhost.)

If you hit any constraints, open an issue on GitHub. I tried to be as thorough as possible in my testing, but there’s only so much a one-man dev team can do. I’m happy assist in troubleshooting and improve the documentation. Rest assured you won’t get a “well, it works in my environment…”