Streamline Digital Evidence Collection with CyberPipe 5.2

I first wrote CyberPipe when I was on the front lines of incident response, driven by the need for more robust and efficient triage collections, whether online or off.  Over the years, CyberPipe continues to adapt and improve, addressing the ever-changing challenges faced by incident response practitioners. 

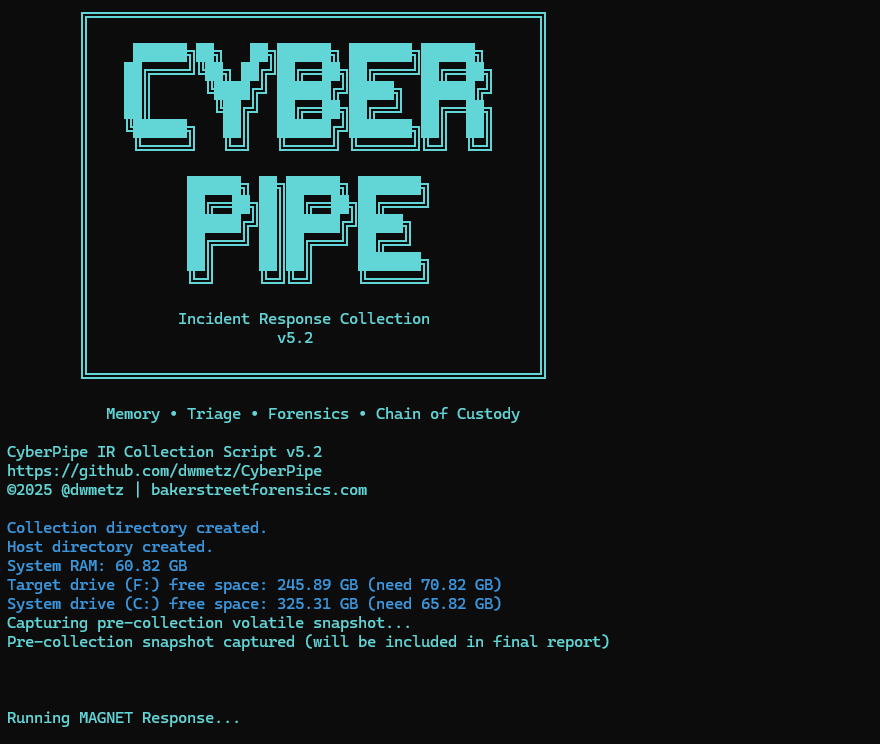
CyberPipe (formerly CSIRT-Collect) is a PowerShell script that is designed to streamline the collection of digital evidence using Magnet Response in enterprise environments, ensuring that responders can gather critical data efficiently and effectively.  Other features include detection of encrypted drives, BitLocker key recovery, and memory image collection.

The most recent update includes enhancements in three areas: Collection, Capabilities, and Reliability.

Screenshot of CyberPipe

🔍 What’s New in 5.2

Intelligent Collection

  • The script now includes dual disk space validation, checking both the target drive and the system drive with profile-aware thresholds to prevent sudden failures due to insufficient space. 
  • A pre-collection volatile snapshot captures uptime, users, connections, and processes to preserve transient state before heavy operations begin.
  • Reports virtual environment detection (VMware, Hyper-V, VirtualBox, etc.) to help analysts understand collection limitations.
  • Real-time progress indicators provide accurate size tracking during the collection, offering responders visibility into the remaining data capture.

Enhanced Capabilities

  • The new QuickTriage profile allows for rapid collection of volatile and system artifacts when time is ticking.
  • BitLocker recovery now includes all volumes, not just the C: drive.
  • A single-file report (CyberPipe-Report.txt) consolidates metadata and a summary of collected artifacts in a human-readable format.
  • All collected artifacts and logs are hashed using SHA-256 to enhance integrity and chain of custody.
  • Output compression is available via the -Compress flag, aiding in storage and transfer.
  • Network collection is simplified with the -Net parameter, eliminating the need for manual network path or configuration edits.

Improved Reliability

  • Profile-aware space checks alert when free space is insufficient for a chosen profile, preventing silent failures.
  • The script now validates exit codes from MAGNET Response to detect failures more effectively.
  • Artifact verification after collection ensures that all expected items were gathered.
  • Error handling and messaging have been refined to provide clearer feedback to the operator.

What I’m hoping this delivers

CyberPipe 5.2 aims to address some challenges observed in real-world triage and live-response operations:

  • Resilience in constrained environments — dual drive checks and profile awareness help prevent mid-collection failures.
  • Better transparency and oversight — real-time progress display and post-collection verification enhance confidence.
  • Faster response options — the QuickTriage profile is suitable when speed is paramount.
  • Stronger forensic hygiene — SHA-256 hashing, improved error detection, and full-volume BitLocker key recovery contribute to defensibility.
  • Easier network deployments — built-in ‘-Net‘ support facilitates smoother remote collection.

As always, CyberPipe is freely available at https://github.com/dwmetz/CyberPipe. Forks and Contributions welcome and appreciated. 

Is there a feature you’d like to see? I think next I might work on support for copying output to AWS/Azure. Thoughts?

Cross-Platform DFIR Tools: MalChelaGUI on Windows

It’s a Trick and a Treat

Sometimes the best breakthroughs are the ones you don’t plan for.  After a routine Windows update this week, I launched MalChelaGUI from the Ubuntu terminal on an Ubuntu WSL2 instance — and it simply opened. No X-server, no environment tweaks, no extra packages.

🎉 😱 A Rust native GUI app on Windows, via Ubuntu WSL terminal!

The latest WSL 2.5 + WSLg 1.0.66 update from Microsoft quietly unlocked full Wayland and GPU acceleration for Linux GUI apps on Windows 11 24H2.  (Note the latest WSL at the time of this post is 2.61)

The result? MalChelaGUI now runs as a true desktop app on Windows, powered entirely by Ubuntu WSL.  


Why This Matters

  •  🧰 No configuration needed — just follow the default instructions at GItHub, and build MalChela as usual.  (WSL, Ubuntu 24.04 or later)
  • 🪟 Native windowing — Clipboard, display scaling, and GPU acceleration all handled automatically.  
  • 🦀 Cross-platform parity — macOS, Linux, and now Windows (via WSL) all run the same GUI experience.

It’s a small but meaningful proof of concept: cross-platform DFIR tooling can now live comfortably in every environment analysts work in — even Windows, without compromise.


Call for Testers

If you’re running Windows 11 24H2 or newer, update WSL and give it a try:

```powershell
wsl --update

Then from Ubuntu WSL

./target/release/MalChelaGUI

If it launches successfully, drop me a note or tag me — I’d love to hear how it behaves across different hardware and GPU setups.

Is your USB device slowing down your forensic investigation?

In digital forensics and incident response, reliable storage isn’t a luxury — it’s a requirement. Whether you’re capturing evidence from a live system, processing large data sets with specialized tools, or running a virtual machine in the middle of a case, storage throughput can make or break your workflow.

The challenge? Reported specifications from manufacturers often don’t tell the full story. A drive rated for up to 400 MB/s might only deliver a fraction of that in real-world use. And performance isn’t determined by the drive alone: the quality of your USB cable, the number of hops between your system and the media (direct vs. through a hub), and the system’s own caching behaviors all play a part.

To eliminate the guesswork, I built Crabwise, a simple USB benchmarking utility designed with forensic workflows in mind.


How Crabwise Works

Crabwise calculates read and write speeds by creating a temporary file on the target device and measuring throughput under direct (uncached) conditions.

  • Write Test: The tool writes a pseudo-random 1 GiB file (size adjustable) to the USB drive in blocks, ensuring that system caching doesn’t skew results.
  • Read Test: It then reads the file back from the device, again bypassing caches, so the reported numbers reflect device-level throughput rather than RAM speeds.
  • Progress Feedback: While testing, Crabwise shows real-time percentages and MB/s estimates, so you can spot performance bottlenecks as they happen.

The result is a clean, standardized benchmark of the USB device’s true performance.


Building a Reference Table

One of the most useful features in Crabwise comes after the test: you’re prompted to save the results to the root of the device. If you choose to do so, Crabwise appends the results to a simple log file called crabwise.log.

Each entry includes:

  • Session name (you provide this — e.g., “coil cable via hub” or “direct to Mac”),
  • Read speed,
  • Write speed,
  • Timestamp of the test.

When you cat the file, you get an instant side-by-side comparison of your runs:

=== crabwise.log ===
coil cable, usb-c hub          |  293.87 Mbps |  295.97 Mbps | 2025-08-27 11:27:09
dual 90 deg cable, usb-c hub   |  293.77 Mbps |  298.57 Mbps | 2025-08-27 11:29:11
dual 90 cable, to mac          |  327.16 Mbps |  331.88 Mbps | 2025-08-27 11:31:02
coil cable, to mac             |  324.74 Mbps |  330.94 Mbps | 2025-08-27 11:32:53

Over time, this builds into a practical reference table that lets you quickly compare how different cables, hubs, and ports affect performance. What looks like a subtle cabling change can sometimes mean the difference between a VM booting smoothly or crawling.


Closing Thoughts

In forensic and investigative work, you don’t always get to choose the hardware you’re handed — but you can make informed decisions about how you connect and use it. Tools like Crabwise give you a way to validate your environment, document your results, and avoid unpleasant surprises when timing matters most.

Whether you’re testing cables, validating a new hub, or verifying a forensic workstation setup, Crabwise turns USB benchmarking into a repeatable, documented process.

Download crabwise from GitHub: https://github.com/dwmetz/crabwise/

Enhance Threat Hunting with MITRE Lookup in MalChela 3.0.2

Understanding adversary behavior is core to modern forensics and threat hunting. With the release of MalChela 3.0.2, I’ve added a new tool to your investigative belt: MITRE Lookup — a fast, offline way to search the MITRE ATT&CK framework directly from your MalChela workspace.

Whether you’re triaging suspicious strings, analyzing IOCs, or pivoting off YARA hits, MalChela can now help you decode tactics, techniques, and procedures without ever leaving your terminal or GUI. MITRE Lookup is powered by a local JSON snapshot of the ATT&CK framework (Enterprise Matrix), parsed at runtime with support for fuzzy searching and clean terminal formatting. No internet required.

What It Does

The MITRE_lookup tool lets you:

  • Search by Technique ID (e.g., T1027, T1566.001)
  • Search by topic or keyword (e.g., ‘RDP’, ‘Wizard Spider’)
  • Get tactic categoryplatforms, and detection guidance
  • Optionally include expanded content with the –full flag
  • Use from the CLIMalChela launcher, or GUI modal

Example:

$ ./target/release/MITRE_lookup -- T1059.003

T1059.003 - Windows Command Shell

Tactic(s): execution

Platforms: Windows

Detection: Usage of the Windows command shell may be common on administrator, developer, or power user systems depending on job function. If scripting is restricted for normal users, then any attempt to enable scripts running on a system would be considered suspicious. If scripts are not commonly used on a system, but enabled, scripts running out of cycle from patching or other administrator functions are suspicious. Scripts should be captured from the file system when possible to determine their actions and intent...
MITRE Lookup (CLI)

GUI Integration

  • Select MITRE Lookup in the left-hand Toolbox menu
  • Use the input field at the top of the modal to enter a keyword or technique ID (e.g., `T1059` or `registry`)
  • Use the “Full” checkbox for un-truncated output
  • “Save to Case” option

Saving for Later

You can save MITRE Lookup results directly from the GUI, either as a standalone markdown file to a designated folder, or into the active Case Notes panel for later reference. This makes it easy to preserve investigative context, cite specific TTPs in reports, or build a threat narrative across multiple tools. The saved output uses clean Markdown formatting — readable in any editor or compatible with case management platforms. This feature is already live in v3.0.2 and will evolve further with upcoming case linkage support.

Markdown view of a MITRE_lookup report

Why MITRE ATT&CK in MalChela?

MalChela already focuses on contextual forensics — understanding not just what an artifact is, but why it matters. By embedding MITRE ATT&CK into your daily toolchain:

  • You reduce pivot fatigue from switching between tools/web tabs
  • You boost investigation speed during triage and reporting
  • You enable a more threat-informed analysis process

Whether you’re tagging findings, crafting YARA rules, or writing case notes, the MITRE integration helps turn technical output into meaningful insight — all from within the MalChela environment.