Those familiar with my work know that I’m a big fan of the REMnux Linux distribution for malware analysis. When I developed MalChela, I included a custom configuration that can be invoked that not only includes the MalChela tool suite but also integrates many of the CLI tools installed in REMnux, providing an easy-to-use GUI.
Recently, a new REMnux release was released on Ubuntu 24.04. This was a welcome upgrade because REMnux was previously locked to 20.04, which was becoming outdated. As soon as I noticed the release announcement, I downloaded the latest version and installed the MalChela suite. Everything ran smoothly, and the GUI interface even appeared slightly sharper without any changes on my part.
While reviewing the release notes for the new version, I discovered that REMnux now includes integration with Opencode AI. In REMnux, several models are preconfigured to recognize the tools included in the distribution and their capabilities and syntax. You can use natural language prompts, and the system will interpret the request, execute the appropriate tools against the file, and provide a summary of the results. As mentioned in the documentation:
The AI uses the REMnux MCP server to run the appropriate REMnux tools automatically. The MCP server offers guidance regarding the tools that the AI should consider, but it’s up to the AI agent to decide on the analysis workflow. And, of course, your interactions, requests, and observations can also direct the AI regarding the analysis steps.
Key capabilities available to AI assistants through the REMnux MCP server:
- Analyze files based on detected type (PE, PDF, Office docs, scripts, ELF, etc.)
- Get tool recommendations for a specific file without running them
- Run specific REMnux tools directly, including piped commands
- Extract indicators of compromise (IOCs) from text
- Get usage help for any installed REMnux tool
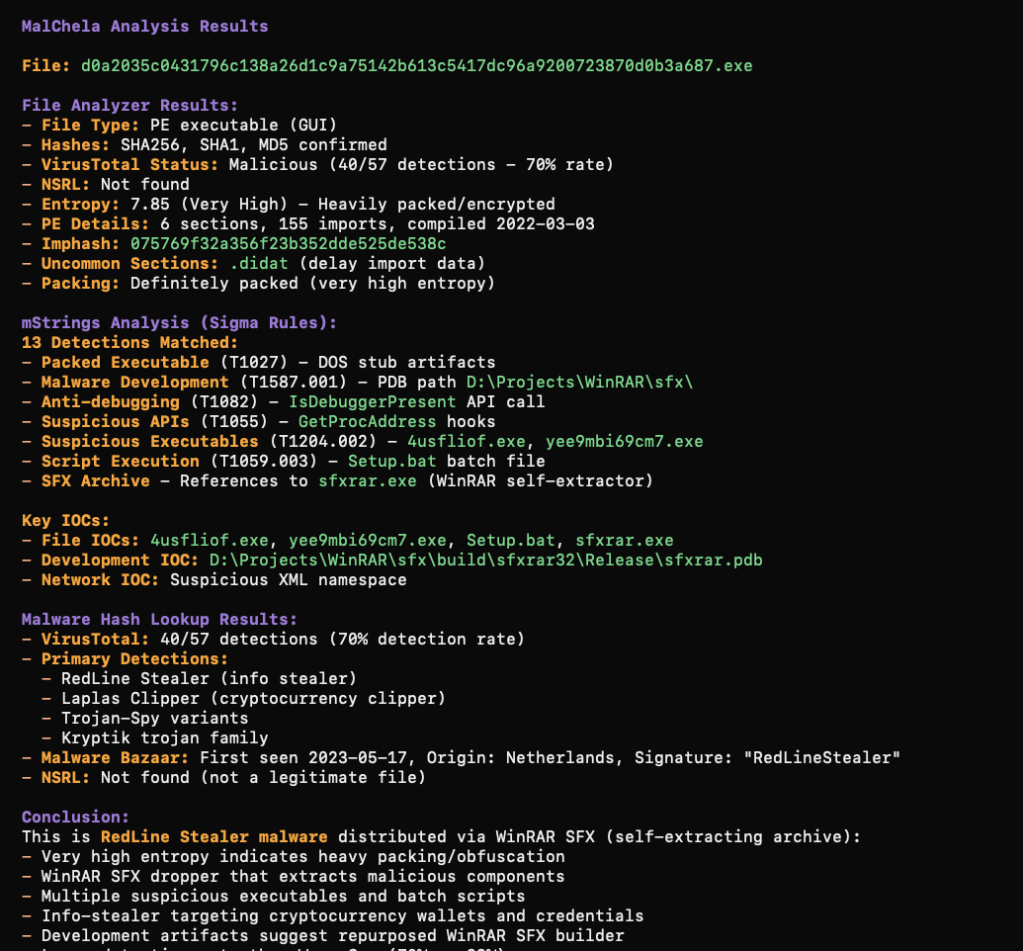
I experimented with a few of the usual suspects in my corpus and provided pretty generic prompts like “analyze (file-xyz)” and “what are the IOCs?” The results were very positive – but I’ve only scratched the surface in testing.
Then I decided to see how adaptive this AI was and how easy it would be to make it aware of new tools and syntax. I provided the following:
MalChela tool suite is  installed in /home/remnux/Tools/MalChela
All are rust based tools so cd to the MalChela directory, and then ./target/release/fileanalyzer (path to executable) would be the syntax.
The 4 tools below are the primary tools for static analysis.
  File Analyzer       |  Get the hash, entropy, packing, PE info, YARA and VT match status for a file
  mStrings            |  Analyzes files with Sigma rules (YAML), extracts strings, matches ReGex.
  NSRL Hash Lookup    |  Query an MD5 or SHA1 hash against NSRL
  Malware Hash Lookup |  Query a hash value against VirusTotal & Malware Bazaar
Immediately it began running the tools in MalChela against the malware file I was previously analyzing and provided a summary of the different tool results.
I plan to do a lot more testing but so far things are looking very promising.
So what do you think? Are you using AI in your malware analysis workflows? What capabilities of AI do you think are most useful when it comes to malware analysis? Let me know in the comments.