When I started building MalChela, I had a narrow problem to solve. I was doing a lot of malware triage during incident response engagements and I kept reaching for the same scattered set of tools — VirusTotal, some strings extraction, a hash lookup here, a YARA scan there. The workflow existed, but it wasn’t a workflow. It was a series of scripts and context switches dressed up as a process. I wanted something that unified those steps under one roof, ran locally, and felt like a tool a forensicator actually built.
What I got was MalChela. What I didn’t expect was how far it would go.
From Rust Experiment to Field Platform
The first version was modest. A handful of tools with a unifying CLI runner. The goal was simple: hash a malware sample, look it up, pull strings, run YARA. The kind of triage you want to do in the first ten minutes with an unknown file.
Version 2 brought a desktop GUI — MalChelaGUI, built on egui/eframe. It was a genuine step up in accessibility. Analysts who weren’t comfortable in the terminal had a way in. The toolset kept growing.
Version 3 added structure around the investigation itself. Case management landed, giving results somewhere to live across a session. MCP server integration followed, opening up a whole new mode of operation — Claude working alongside the tools, not just alongside me.
But the GUI carried freight. It meant building for a specific platform, managing a Rust GUI dependency chain, and ultimately shipping something that couldn’t easily follow MalChela into its most interesting new use case: the field.
Toby Changed Everything
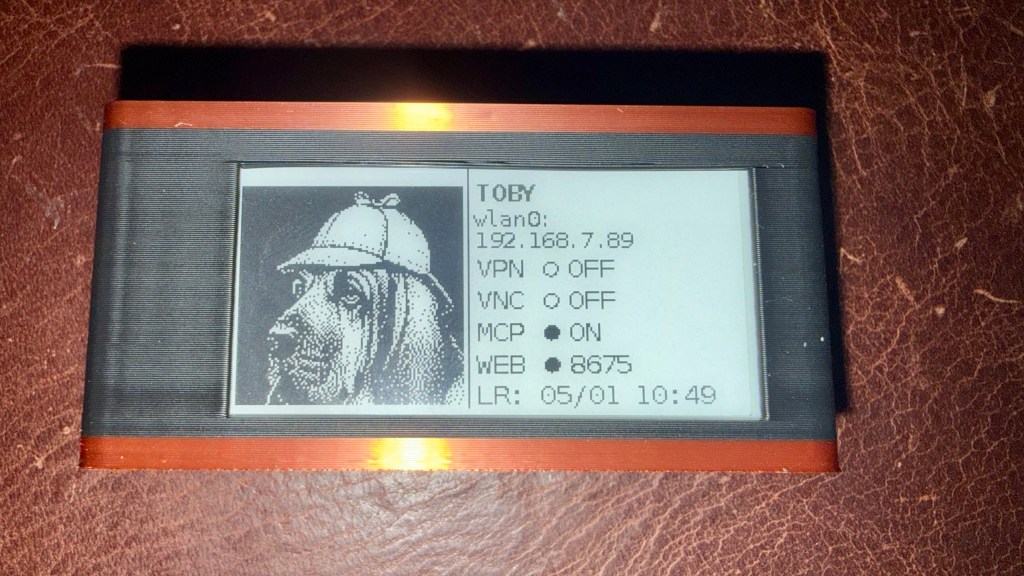
If you’ve been following Baker Street Forensics for the last few months, you’ve seen the ‘TOBYgotchi‘ project take shape — a Raspberry Pi Zero 2W running Kali Linux, with a Waveshare e-ink display, PiSugar battery, and MalChela pre-installed. Boot it up, it announces itself on the network, and you’re ready to triage. And yes, I am working on making a full build of TOBY available to the public. Stay tuned…
The original field kit vision was: SSH in, run tools from the CLI, pull results. Simple and functional. But the more I used Toby in practice, the more I wanted a better interface — something that worked without a terminal, something a colleague could pick up at a scene without knowing the command syntax.
MalChelaGUI on a Pi Zero 2W is possible but not comfortable. The egui overhead, the X display stack, remote display via VNC — it all works, but it’s friction. What I wanted was something lighter. Something any browser on the network could reach. Something that felt native on an iPad.
That’s what pulled me toward the PWA.
v4.0: The PWA Takes Over
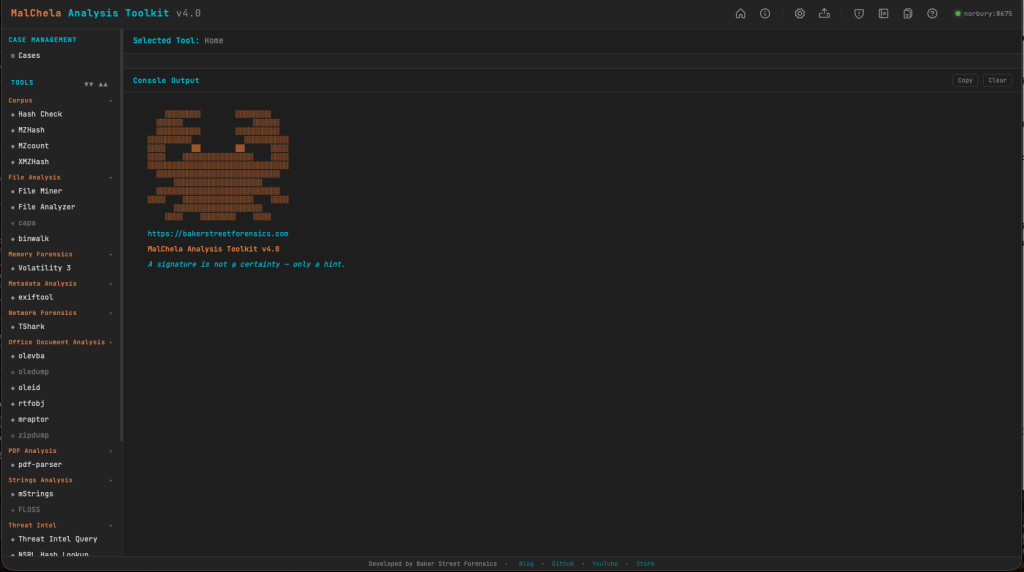
MalChela v4.0 retires the desktop GUI entirely and replaces it with a Progressive Web App as the primary interface.
Every tool that lived in MalChelaGUI has been ported. Most have been improved in the process. The PWA is served locally from the server/ directory — run setup-server.sh once after building the binaries, then start-server.sh on every subsequent boot. Open any browser on the local network and you’re in.
On Toby, this is now part of autostart. Boot the Pi — battery-powered, no cables required — and the server comes up automatically. Connect from your desktop, phone or iPad directly to the PWA. No VNC, no X display overhead, no SSH tunnel. Just a browser pointing at the Pi’s IP.
And here’s the part that makes it genuinely useful in the field: you can upload files directly from whatever device you’re browsing from to the MalChela server. Phone, iPad, laptop — if it has a browser and can reach Toby on the network, it can submit a sample for analysis. The triage station travels with you, and so does the interface.
This is still a work in progress, but the direction is clear: a battery-powered Pi you can drop on a table at a scene, pull out your tablet, and start triaging — no keyboard, no monitor, no additional hardware required.
The field kit I was imagining finally snapped into focus.
REMnux Support
Running MalChela on a REMnux instance? It’s now even easier to load the REMnux configuration tools.yaml.
Configuration > tools.yaml > Load REMnux
then refresh the browser and you’ve got access to all the REMnux CLI tools from within MalChela.
What Else Is New
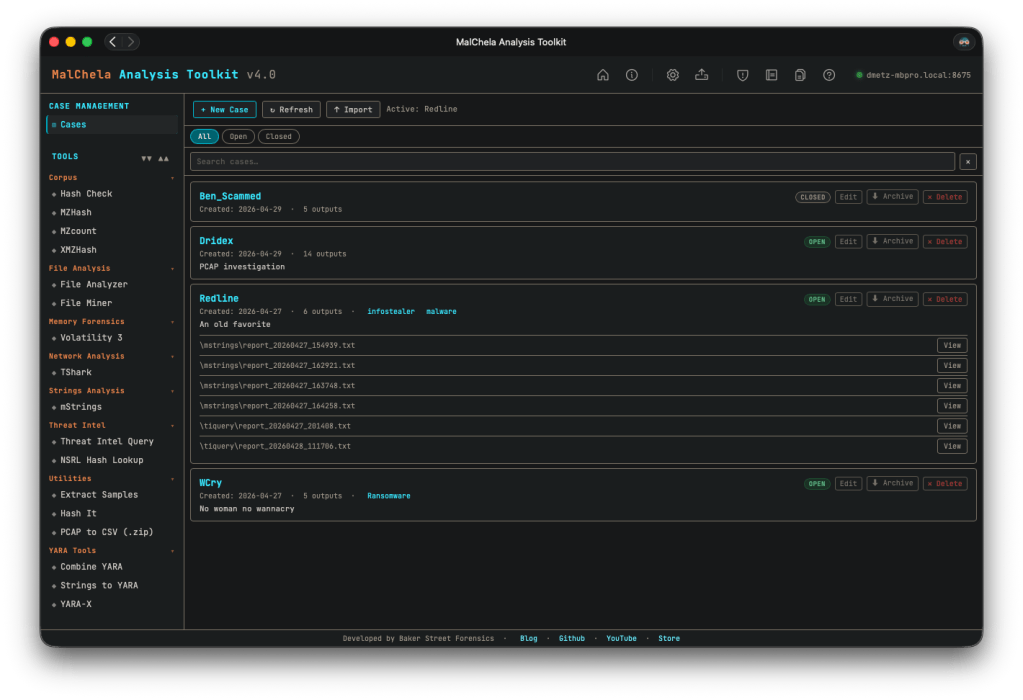
Simplified case management. This one’s been on my list for a while. In previous versions, case management was tied to starting with a file or folder — you had to know what you were investigating before you could create a case. That’s not how IR actually works. v4.0 breaks that dependency: any result can be saved to a case, and you can create a new case from within a running tool session. All the output, whether from the included cargo tools, or 3rd party add-ons like TShark or Volatility, can be saved to your case. The investigation defines the case, not the other way around.
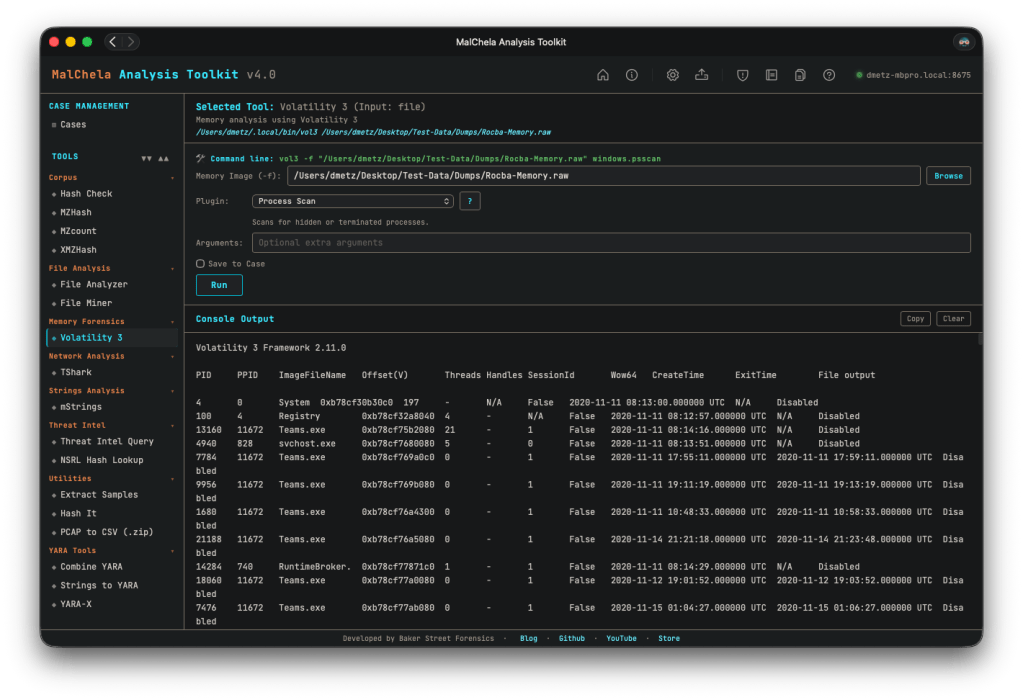
Improved Volatility support. The Volatility integration got a meaningful UX overhaul. The reference panel has been improved, and output now streams inline within the PWA — no more spawning a separate terminal window to see results, which was one of the more awkward edges of the old GUI experience.
Rapid tool iteration via tools.yaml. The PWA is built around a tools.yaml configuration file that defines the tool manifest. Add a new tool, update the YAML, refresh the interface — done. No recompiling the GUI, no rebuilding the binary for a UI change. This makes extending MalChela considerably faster in practice, and opens the door for community-contributed tool configs down the road.
The CLI isn’t going anywhere. If you’re scripting triage workflows, running MalChela headless in an automated pipeline, or just prefer the terminal, everything you relied on in v3.x is still there. The PWA is the new face of MalChela; the CLI is still the engine.
Want to run MalChela on Windows? You can build it in an Ubuntu instance in WSL. Once you start the server in WSL, the Windows host can access the PWA via http://localhost:8675. (In modern WSL2 Microsoft automatically forwards WSL loopback → Windows localhost.)
If you hit any constraints, open an issue on GitHub. I tried to be as thorough as possible in my testing, but there’s only so much a one-man dev team can do. I’m happy assist in troubleshooting and improve the documentation. Rest assured you won’t get a “well, it works in my environment…”
There’s a moment every analyst knows — the one where an unknown file lands on your desk and the clock starts ticking. You need answers, and you need them fast. MalChela was built for exactly that moment.
Today I’m excited to announce the MalChela Video Series on YouTube — a growing collection of tutorial episodes walking through real malware analysis workflows using MalChela, the open-source Rust-based toolkit I’ve been building for the DFIR community. Whether you’re new to the tool or already running it in your lab, there’s something here for you.
Four episodes are available right now in the playlist.
What’s in the Playlist
Ep0 | Installation & First Run
Every case starts somewhere. Episode 0 is your onboarding — installing MalChela, walking through its dependencies, and getting oriented with both the CLI and GUI modes. If you’ve been curious about the tool but weren’t sure where to start, this is the episode to bookmark.
Ep1 | First Contact: Hash, Inspect, Identify
You’ve just been handed a suspicious file. What do you do first?
This episode covers the first three tools in a malware triage workflow — the exact sequence I reach for every time I encounter an unknown file:
hashit — generate MD5, SHA1, and SHA256 hashes to protect chain of custody and enable deduplication
fileanalyzer — static inspection: entropy analysis, PE header fields, compile timestamps, and import tables
malhash — simultaneous lookup against VirusTotal and MalwareBazaar to identify known malware families
By the end of this episode, you’ll take an unknown file from zero to confirmed malware family identification in under five minutes — no sandboxing required.
Ep2 | From Strings to Signatures
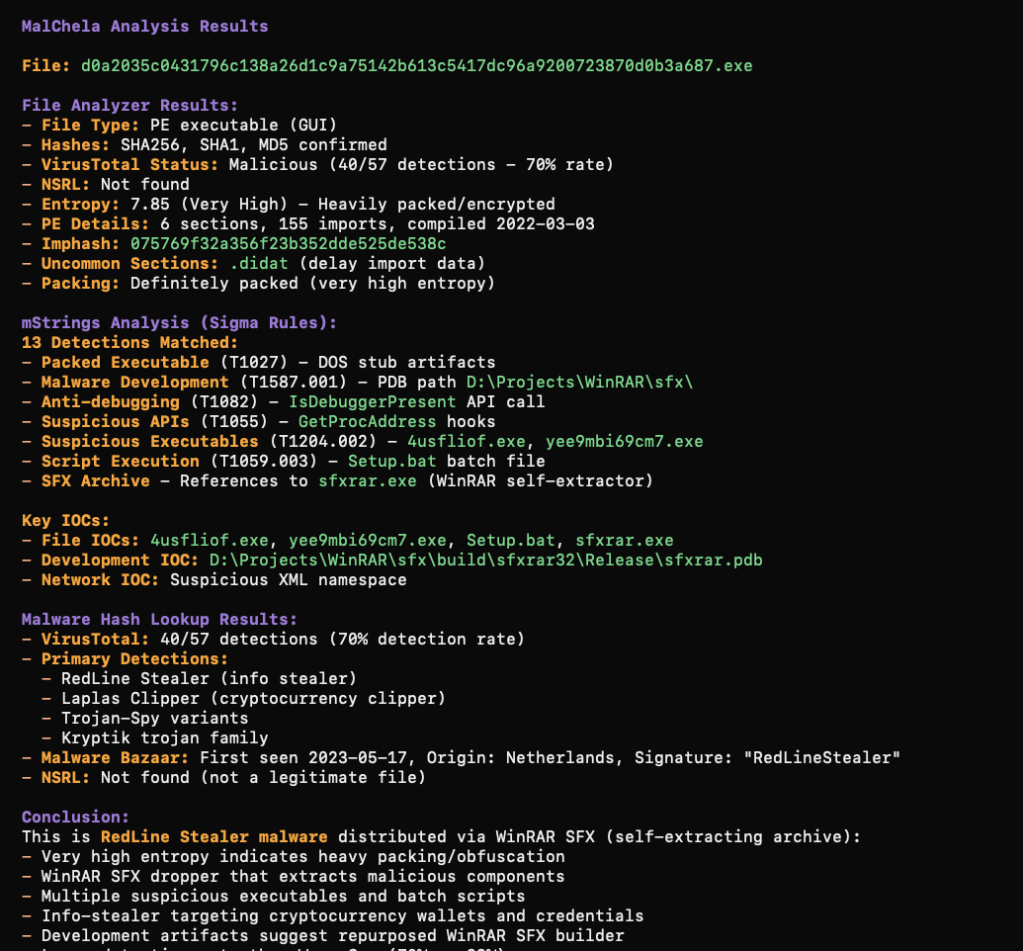
Continuing from Episode 1, we go deeper into the confirmed RedLine info-stealer sample using mStrings — MalChela’s string extraction engine. Unlike the traditional strings utility, mStrings runs every extracted string through a detection ruleset and MITRE ATT&CK mapping layer simultaneously, turning raw output into actionable intelligence.
We walk through 62 detections, including PDB path artifacts, hard-coded dropper filenames, WMI queries, credential harvesting patterns, anti-debug checks, and a code injection setup. We then feed the extracted IOCs into Strings2YARA to auto-generate a structured YARA rule — and confirm it fires against the sample using File Analyzer.
By the end, you’ll be reading a malware file not as a pile of strings, but as a window into the attacker’s tradecraft.
Ep3 | REMnux Mode & Custom Tools
MalChela doesn’t work in isolation. Episode 3 covers how to extend the toolkit through the tools.yaml config file and how enabling REMnux mode surfaces an entire distro’s worth of malware analysis utilities directly within MalChela’s interface.
We also explore three built-in integrations: Volatility 3 with a dynamic plugin builder, T-Shark with a searchable reference, and YARA-X — a faster, Rust-native rewrite of YARA.
What’s Coming
The series is ongoing. Future episodes will push further into advanced workflows — think directory-scale triage, corpus management, and the AI-assisted analysis capabilities introduced in MalChela’s MCP integration. Stay subscribed and you won’t miss them.
Get Involved
If MalChela is useful in your work, the best thing you can do is help spread the word:
📺 Subscribe to the YouTube channel — Subscribe to the channel and save the playlist so you don’t miss new episodes as they land.
📖 Follow Baker Street Forensics — Writeups, major releases, and workflow deep dives live here.
💬 Share and comment — If an episode clicks for you, pass it along to a colleague or drop a comment on the video. That feedback genuinely shapes what comes next.
The game is afoot. Let’s get to work.
MalChela is open-source and freely available. Find the project on GitHub.
In a previous post I wrote about integrating MalChela with OpenCode on REMnux and giving the AI a quick briefing on the tool suite so it could incorporate them into its analysis workflow. That was a promising proof of concept, but it raised a natural follow-up question: how do you make these integrations more robust, reproducible, and persistent?
Since that post, I’ve been experimenting with three different approaches to bringing MalChela into AI-assisted workflows — each suited to a different environment and use case. This post walks through all three.
Approach 1: The Kali MCP Server (Toby)
The first implementation started with Toby — my portable Raspberry Pi forensics toolkit running a customized Kali Linux build. Toby is designed for headless operation via SSH, which turns out to be exactly the right architecture for an MCP server. The developers of Kali recently added an update to support MCP integrations. (See https://www.kali.org/blog/kali-llm-claude-desktop/)
Model Context Protocol (MCP) is an open standard that allows AI assistants like Claude to interface with external tools and systems in a structured, reliable way. Instead of pasting instructions into a chat window each session, you define your tools once in a server configuration and the AI has consistent, persistent access to them.
The setup leverages an existing open-source mcp-kali-server that exposes Kali’s forensic and security tooling as MCP tools. On the client side (Mac), the claude_desktop_config.json simply points to Toby (or your Kali box) over SSH:
{
"mcpServers": {
"mcp-kali-server": {
"command": "ssh",
"args": [
"-i",
"/Users/dwmetz/.ssh/id_ed25519",
"dwmetz@192.168.10.89",
"mcp-server"
],
"transport": "stdio"
}
}
}
With this in place, Claude Desktop has persistent, session-independent access to Kali’s toolkit running on Toby. No need to re-brief the AI each session — the tools are always available and always described the same way.
Key prerequisite: passwordless SSH key-based auth between your Mac and Toby. If you haven’t set that up:
ssh-keygen -t ed25519
ssh-copy-id user@<toby/kali-ip>
# Then one manual SSH to accept the host key fingerprint
ssh user@<toby/kali-ip>
Adding MalChela to the Kali MCP Server
The mcp-kali-server ships with routes for Kali’s built-in security tools, but MalChela isn’t included out of the box. Adding it requires changes to two files: kali_server.py (the Flask API backend) and mcp_server.py (the FastMCP frontend). Both live at /usr/share/mcp-kali-server/.
How the architecture works:mcp_server.py is what Claude talks to — it defines MCP tool names, descriptions, and parameter schemas. When a tool is called, it POSTs to kali_server.py, which constructs the actual shell command and executes it on Toby. The critical detail is that MalChela’s binaries must be run from within the MalChela workspace directory — running them from an arbitrary working directory causes failures. The cd {MALCHELA_DIR} && prefix in every command handles this.
kali_server.py changes
Add the MALCHELA_DIR constant (update with your MalChela install path) and Flask routes after the existing tool routes, before the health check endpoint:
Important note on malhash: Unlike the other tools which take a file path, malhash takes a hash string as its argument. The route reads a hash parameter and passes it directly to the binary. Passing a filepath to malhash will fail silently — a subtle but critical distinction.
mcp_server.py changes
The MalChela tool definitions need to be added to the setup_mcp_server() function, immediately before the return mcp line.
    @mcp.tool(name="malchela_fileanalyzer")
    def malchela_fileanalyzer(filepath: str) -> Dict[str, Any]:
        """
        MalChela: Static file analysis - hashes, entropy, packing detection,
        PE metadata (imports, sections, timestamps), YARA matches, VirusTotal status.
        Best first step for any unknown file.

        Args:
            filepath: Absolute path to the file to analyze

        Returns:
            Analysis report
        """
        return kali_client.safe_post("api/tools/malchela/fileanalyzer", {"filepath": filepath})

    @mcp.tool(name="malchela_mstrings")
    def malchela_mstrings(filepath: str) -> Dict[str, Any]:
        """
        MalChela: String extraction with IOC detection and MITRE ATT&CK mapping.
        Applies Sigma-style detection rules, flags suspicious patterns (registry keys,
        encoded payloads, suspicious DLL+API combos), maps findings to ATT&CK techniques.

        Args:
            filepath: Absolute path to the file to analyze

        Returns:
            String analysis with ATT&CK mappings and IOCs
        """
        return kali_client.safe_post("api/tools/malchela/mstrings", {"filepath": filepath})

    @mcp.tool(name="malchela_malhash")
    def malchela_malhash(hash: str) -> Dict[str, Any]:
        """
        MalChela: Query a file hash against VirusTotal and MalwareBazaar.
        Returns detection ratio, AV verdicts, first/last seen dates, and sample metadata.
        Requires VT_API_KEY env var; MB_API_KEY optional.

        Args:
            hash: MD5, SHA1, or SHA256 hash string to query

        Returns:
            Threat intel results from VirusTotal and MalwareBazaar
        """
        return kali_client.safe_post("api/tools/malchela/malhash", {"hash": hash})

    @mcp.tool(name="malchela_hashit")
    def malchela_hashit(filepath: str) -> Dict[str, Any]:
        """
        MalChela: Generate MD5, SHA1, and SHA256 hashes for a single file.
        Lightweight when you need hashes without full fileanalyzer output.

        Args:
            filepath: Absolute path to the file

        Returns:
            File hashes
        """
        return kali_client.safe_post("api/tools/malchela/hashit", {"filepath": filepath})

    @mcp.tool(name="malchela_fileminer")
    def malchela_fileminer(folderpath: str) -> Dict[str, Any]:
        """
        MalChela: Scan a folder for file type mismatches and metadata anomalies.
        Classifies all files, flags executables disguised as other types.

        Args:
            folderpath: Absolute path to the folder to scan

        Returns:
            File classification and anomaly report
        """
        return kali_client.safe_post("api/tools/malchela/fileminer", {"dirpath": folderpath})

    return mcp
One parameter naming detail worth noting: mcp_server.py receives folderpath from Claude, but must pass it as dirpath in the JSON body to kali_server.py — that’s what the Flask route reads. The tool definition above handles this correctly.
After saving both files, restart the MCP server and restart Claude Desktop.
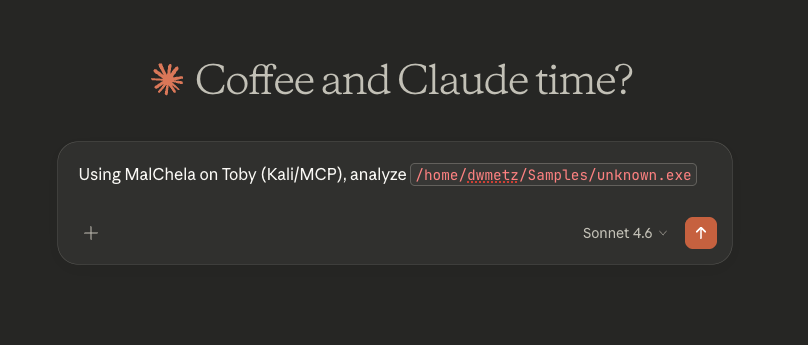
Testing on an unknown malware sample
[below is the exact response received from Claude]
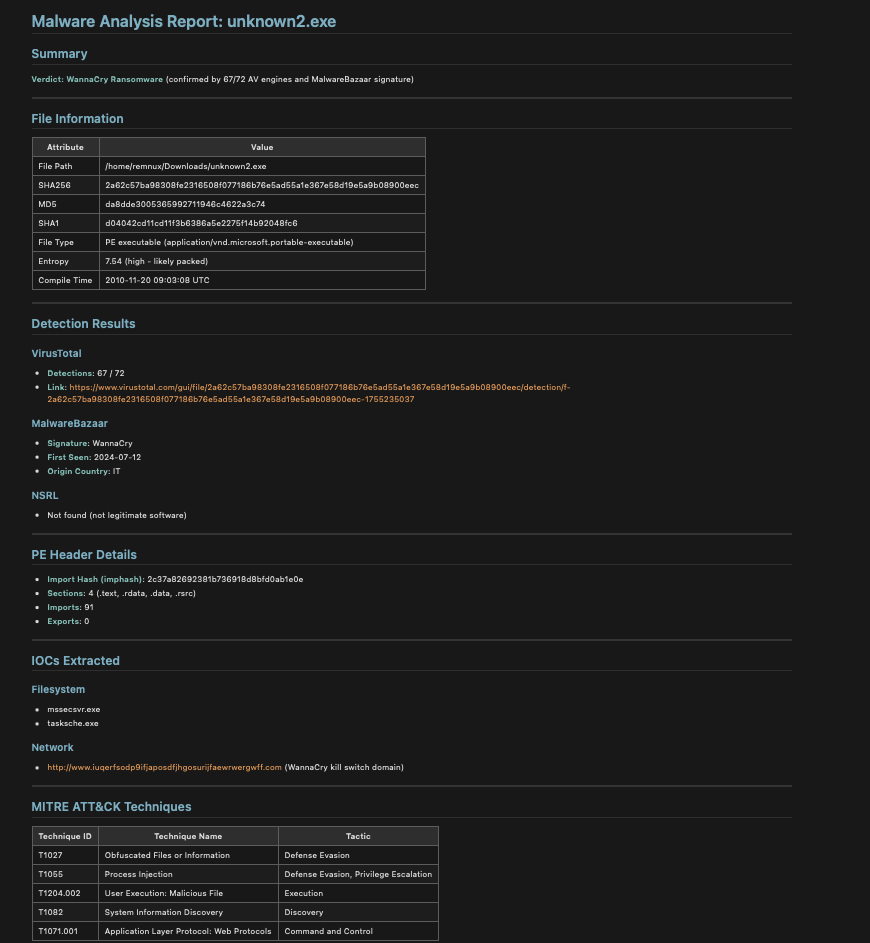
I’ll run MalChela analysis on that file via Toby. Let me load the tools first.Tools loaded. Running fileanalyzer first for static analysis, then mstrings for IOC/ATT&CK mapping. Let me verify the path exists:File confirmed on Toby. The MalChela MCP tools use local paths — let me run it directly via the Kali execute_command since the MCP path routing doesn’t map Toby paths. I’ll invoke MalChela’s binaries directly:MalChela binaries found. Running the full suite now:That’s already very telling. Now running mstrings for IOC and ATT&CK mapping:Now let me pull the VirusTotal intel on the hash:That’s a solid picture. Here’s the full analysis breakdown:
5 PE sections including .ndata (atypical NSIS section, flagged as suspicious)
159 imports, including the dangerous trio:
GetProcAddress / LoadLibraryExA — dynamic API resolution (evasion)
ShellExecuteExA — process execution
🎯 MITRE ATT&CK Mappings (from mstrings)
Technique
ID
Tactic
Obfuscated Files or Information
T1027
Defense Evasion
Process Injection
T1055
Defense Evasion / Privilege Escalation
Application Layer Protocol: Web Protocols
T1071.001
Command and Control
🌐 Network IOC
http://nsis.sf.net/NSIS_Error — NSIS error handler URL (confirms NSIS wrapper), not inherently malicious but characteristic of GuLoader’s packaging
Summary
This is a live GuLoader sample — an NSIS-wrapped shellcode injector/downloader commonly used as a first-stage payload to retrieve second-stage malware (often AgentTesla, Remcos RAT, FormBook, etc.). The high entropy, dynamic API loading, and process injection indicators are all consistent with GuLoader’s known behavior. Treat this as active malware — do not execute outside an isolated sandbox.
Approach 2: Persistent MalChela Instructions in OpenCode on REMnux
The REMnux OpenCode integration I described in the previous post worked, but it had one friction point: each new session required re-pasting the MalChela context. OpenCode has a solution for this — the AGENTS.md file.
Place an AGENTS.md file in your working directory (or MalChela’s root directory) and OpenCode will automatically load it as persistent context for every session started from that location. This is the most lightweight way to make MalChela tool-aware without building any infrastructure.
Create the file at /home/remnux/Tools/MalChela/AGENTS.md:
# MalChela Tool Instructions for AI Assistants
MalChela is installed at: /home/remnux/Tools/MalChela
All tools are Rust binaries. The execution pattern is:
1. fileanalyzer - establish baseline: hashes, entropy, PE headers
2. mstrings - extract strings, look for IOCs and ATT&CK technique indicators
3. malhash - check community threat intelligence
4. nsrlquery - confirm or rule out known-good status
## Environment Notes
- API keys (VT_API_KEY, MB_API_KEY) should be set in the shell environment
- MalChela integrates with REMnux tools; use REMnux CLI tools in conjunction as needed
- Case management is available via the MalChela GUI if a graphical session is active
When you start an OpenCode session from the MalChela directory, this context is automatically loaded. No manual pasting, no re-briefing.
Once complete I asked it to save the results to the Desktop in markdown.
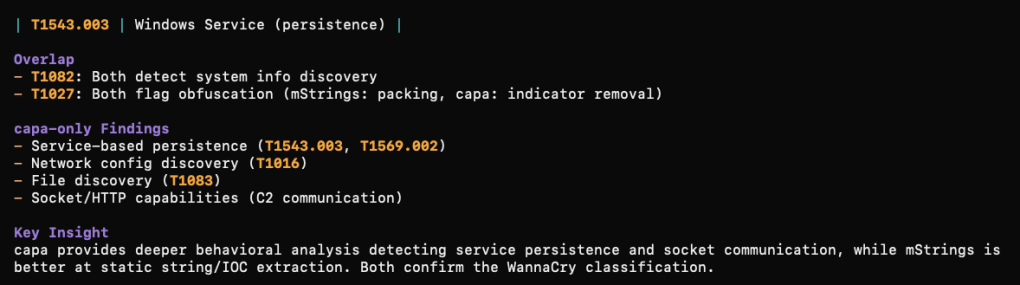
What was cool to me about this approach is that using the installed REMnux tools, you can take the analysis further after MalChela. In my testing I (OpenCode) analyzed a file with mStrings. We then followed up by running capa against the file. From there we could compare what each tool detected and missed in the sample. (screenshot truncated)
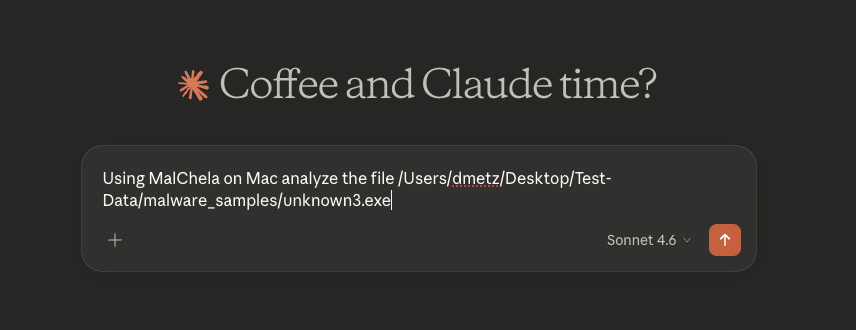
Approach 3: MalChela as a Native MCP Server (Mac)
The most powerful integration is running MalChela as its own dedicated MCP server — making its tools directly available to Claude Desktop alongside the Kali server. This is what we built out as mcp-malchela.
The server is a small Node.js project that wraps MalChela’s binaries with proper MCP tool definitions. The key files are index.js (the server logic) and package.json.
package.json:
{
"name": "mcp-malchela",
"version": "1.0.0",
"description": "MCP server exposing MalChela malware analysis tools",
"main": "index.js",
"dependencies": {
"@modelcontextprotocol/sdk": "^1.0.0"
}
}
index.js — the server defines each MalChela tool with its input schema, executes the binary when called, and streams back results. Note that malhash is handled differently from the other tools — it receives a hash string rather than a filepath, so the argument routing accounts for that explicitly:
import { Server } from "@modelcontextprotocol/sdk/server/index.js";
import { StdioServerTransport } from "@modelcontextprotocol/sdk/server/stdio.js";
import { CallToolRequestSchema, ListToolsRequestSchema } from "@modelcontextprotocol/sdk/types.js";
WMI usage — likely for system enumeration pre-exfil
Bottom Line
This is a Go-compiled password/credential stealer targeting browsers (Firefox cookies, Discord tokens, Yandex Browser), using WebSocket for C2, with WMI-based discovery. It was UPX-packed (this is the unpacked copy), has a zeroed compile timestamp to defeat timestamp-based triage, and was submitted to MalwareBazaar just hours ago — very fresh sample. Do not execute in any environment without proper isolation.
All three approaches solve the same core problem from the original post: making the AI reliably aware of your tools without re-briefing it every session. The right choice depends on your primary analysis environment — or, if you’re like me, you end up running all three.
All of the configuration files discussed here — including the MCP server setup and the are available in the MalChela repository on GitHub. Clone or pull the latest and you should be ready to go. As always, if you run into issues or have ideas for where to take the MCP integration next, open an issue or drop me a note.
Those familiar with my work know that I’m a big fan of the REMnux Linux distribution for malware analysis. When I developed MalChela, I included a custom configuration that can be invoked that not only includes the MalChela tool suite but also integrates many of the CLI tools installed in REMnux, providing an easy-to-use GUI.
Recently, a new REMnux release was released on Ubuntu 24.04. This was a welcome upgrade because REMnux was previously locked to 20.04, which was becoming outdated. As soon as I noticed the release announcement, I downloaded the latest version and installed the MalChela suite. Everything ran smoothly, and the GUI interface even appeared slightly sharper without any changes on my part.
While reviewing the release notes for the new version, I discovered that REMnux now includes integration with Opencode AI. In REMnux, several models are preconfigured to recognize the tools included in the distribution and their capabilities and syntax. You can use natural language prompts, and the system will interpret the request, execute the appropriate tools against the file, and provide a summary of the results. As mentioned in the documentation:
The AI uses the REMnux MCP server to run the appropriate REMnux tools automatically. The MCP server offers guidance regarding the tools that the AI should consider, but it’s up to the AI agent to decide on the analysis workflow. And, of course, your interactions, requests, and observations can also direct the AI regarding the analysis steps.
Key capabilities available to AI assistants through the REMnux MCP server:
Analyze files based on detected type (PE, PDF, Office docs, scripts, ELF, etc.)
Get tool recommendations for a specific file without running them
Run specific REMnux tools directly, including piped commands
Extract indicators of compromise (IOCs) from text
Get usage help for any installed REMnux tool
I experimented with a few of the usual suspects in my corpus and provided pretty generic prompts like “analyze (file-xyz)” and “what are the IOCs?” The results were very positive – but I’ve only scratched the surface in testing.
Then I decided to see how adaptive this AI was and how easy it would be to make it aware of new tools and syntax. I provided the following:
MalChela tool suite is  installed in /home/remnux/Tools/MalChela
All are rust based tools so cd to the MalChela directory, and then ./target/release/fileanalyzer (path to executable) would be the syntax.
The 4 tools below are the primary tools for static analysis.
  File Analyzer       |  Get the hash, entropy, packing, PE info, YARA and VT match status for a file
  mStrings            |  Analyzes files with Sigma rules (YAML), extracts strings, matches ReGex.
  NSRL Hash Lookup    |  Query an MD5 or SHA1 hash against NSRL
  Malware Hash Lookup |  Query a hash value against VirusTotal & Malware Bazaar
Immediately it began running the tools in MalChela against the malware file I was previously analyzing and provided a summary of the different tool results.
I plan to do a lot more testing but so far things are looking very promising.
So what do you think? Are you using AI in your malware analysis workflows? What capabilities of AI do you think are most useful when it comes to malware analysis? Let me know in the comments.