Is your USB device slowing down your forensic investigation?

In digital forensics and incident response, reliable storage isn’t a luxury — it’s a requirement. Whether you’re capturing evidence from a live system, processing large data sets with specialized tools, or running a virtual machine in the middle of a case, storage throughput can make or break your workflow.

The challenge? Reported specifications from manufacturers often don’t tell the full story. A drive rated for up to 400 MB/s might only deliver a fraction of that in real-world use. And performance isn’t determined by the drive alone: the quality of your USB cable, the number of hops between your system and the media (direct vs. through a hub), and the system’s own caching behaviors all play a part.

To eliminate the guesswork, I built Crabwise, a simple USB benchmarking utility designed with forensic workflows in mind.

How Crabwise Works

Crabwise calculates read and write speeds by creating a temporary file on the target device and measuring throughput under direct (uncached) conditions.

  • Write Test: The tool writes a pseudo-random 1 GiB file (size adjustable) to the USB drive in blocks, ensuring that system caching doesn’t skew results.
  • Read Test: It then reads the file back from the device, again bypassing caches, so the reported numbers reflect device-level throughput rather than RAM speeds.
  • Progress Feedback: While testing, Crabwise shows real-time percentages and MB/s estimates, so you can spot performance bottlenecks as they happen.

The result is a clean, standardized benchmark of the USB device’s true performance.


Building a Reference Table

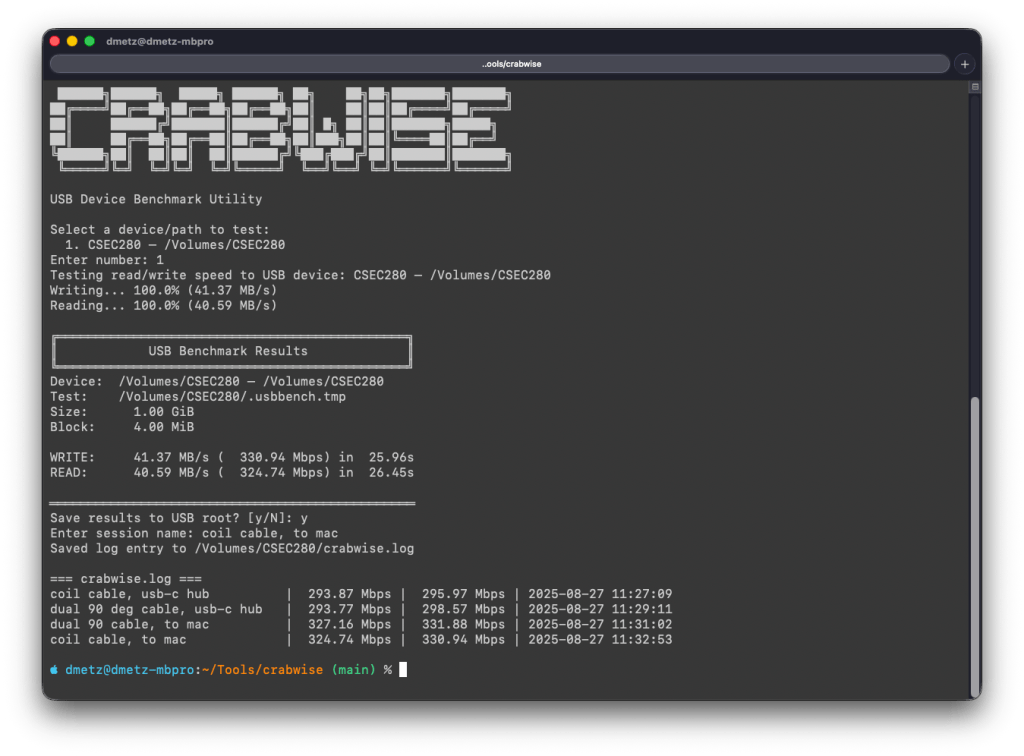
One of the most useful features in Crabwise comes after the test: you’re prompted to save the results to the root of the device. If you choose to do so, Crabwise appends the results to a simple log file called crabwise.log.

Each entry includes:

  • Session name (you provide this — e.g., “coil cable via hub” or “direct to Mac”),
  • Read speed,
  • Write speed,
  • Timestamp of the test.

When you cat the file, you get an instant side-by-side comparison of your runs:

=== crabwise.log ===
coil cable, usb-c hub          |  293.87 Mbps |  295.97 Mbps | 2025-08-27 11:27:09
dual 90 deg cable, usb-c hub   |  293.77 Mbps |  298.57 Mbps | 2025-08-27 11:29:11
dual 90 cable, to mac          |  327.16 Mbps |  331.88 Mbps | 2025-08-27 11:31:02
coil cable, to mac             |  324.74 Mbps |  330.94 Mbps | 2025-08-27 11:32:53

Over time, this builds into a practical reference table that lets you quickly compare how different cables, hubs, and ports affect performance. What looks like a subtle cabling change can sometimes mean the difference between a VM booting smoothly or crawling.


Closing Thoughts

In forensic and investigative work, you don’t always get to choose the hardware you’re handed — but you can make informed decisions about how you connect and use it. Tools like Crabwise give you a way to validate your environment, document your results, and avoid unpleasant surprises when timing matters most.

Whether you’re testing cables, validating a new hub, or verifying a forensic workstation setup, Crabwise turns USB benchmarking into a repeatable, documented process.

Download crabwise from GitHub: https://github.com/dwmetz/crabwise/

Enhance Threat Hunting with MITRE Lookup in MalChela 3.0.2

Understanding adversary behavior is core to modern forensics and threat hunting. With the release of MalChela 3.0.2, I’ve added a new tool to your investigative belt: MITRE Lookup — a fast, offline way to search the MITRE ATT&CK framework directly from your MalChela workspace.

Whether you’re triaging suspicious strings, analyzing IOCs, or pivoting off YARA hits, MalChela can now help you decode tactics, techniques, and procedures without ever leaving your terminal or GUI. MITRE Lookup is powered by a local JSON snapshot of the ATT&CK framework (Enterprise Matrix), parsed at runtime with support for fuzzy searching and clean terminal formatting. No internet required.

What It Does

The MITRE_lookup tool lets you:

  • Search by Technique ID (e.g., T1027, T1566.001)
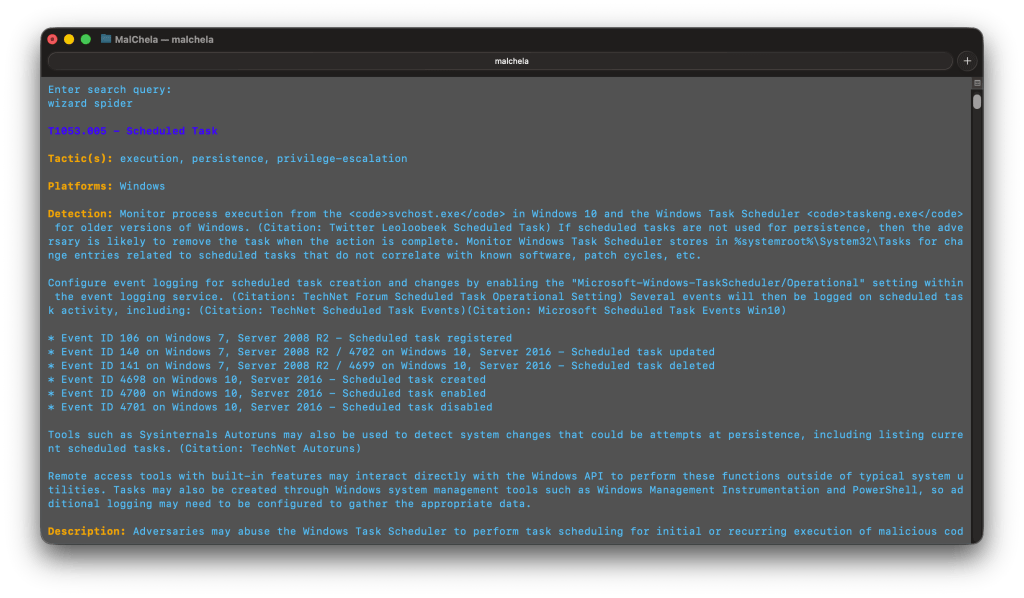
  • Search by topic or keyword (e.g., ‘RDP’, ‘Wizard Spider’)
  • Get tactic categoryplatforms, and detection guidance
  • Optionally include expanded content with the –full flag
  • Use from the CLIMalChela launcher, or GUI modal

Example:

$ ./target/release/MITRE_lookup -- T1059.003

T1059.003 - Windows Command Shell

Tactic(s): execution

Platforms: Windows

Detection: Usage of the Windows command shell may be common on administrator, developer, or power user systems depending on job function. If scripting is restricted for normal users, then any attempt to enable scripts running on a system would be considered suspicious. If scripts are not commonly used on a system, but enabled, scripts running out of cycle from patching or other administrator functions are suspicious. Scripts should be captured from the file system when possible to determine their actions and intent...
MITRE Lookup (CLI)

GUI Integration

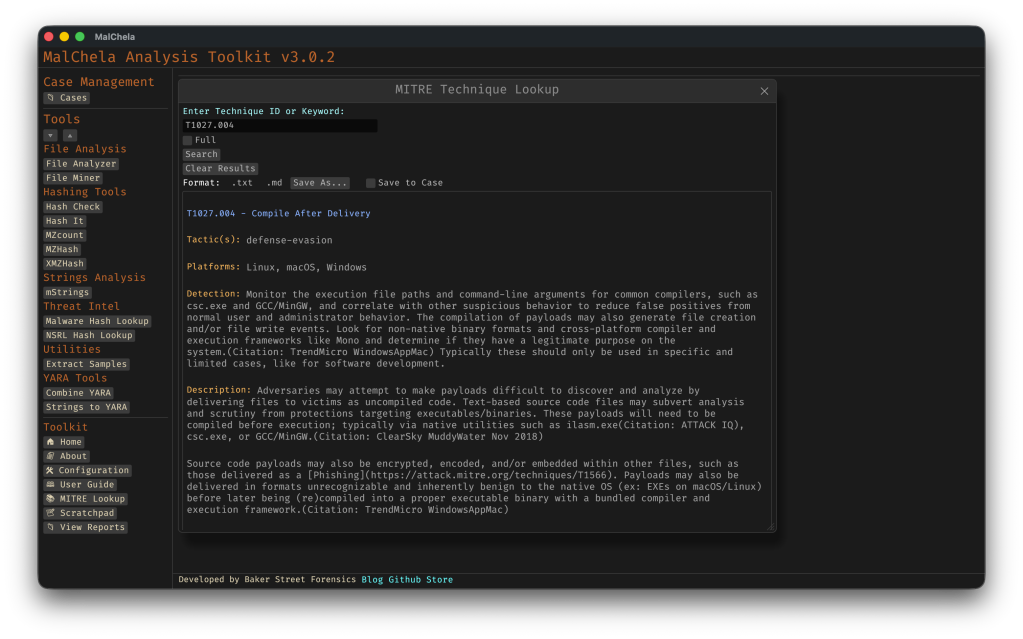
  • Select MITRE Lookup in the left-hand Toolbox menu
  • Use the input field at the top of the modal to enter a keyword or technique ID (e.g., `T1059` or `registry`)
  • Use the “Full” checkbox for un-truncated output
  • “Save to Case” option

Saving for Later

You can save MITRE Lookup results directly from the GUI, either as a standalone markdown file to a designated folder, or into the active Case Notes panel for later reference. This makes it easy to preserve investigative context, cite specific TTPs in reports, or build a threat narrative across multiple tools. The saved output uses clean Markdown formatting — readable in any editor or compatible with case management platforms. This feature is already live in v3.0.2 and will evolve further with upcoming case linkage support.

Markdown view of a MITRE_lookup report

Why MITRE ATT&CK in MalChela?

MalChela already focuses on contextual forensics — understanding not just what an artifact is, but why it matters. By embedding MITRE ATT&CK into your daily toolchain:

  • You reduce pivot fatigue from switching between tools/web tabs
  • You boost investigation speed during triage and reporting
  • You enable a more threat-informed analysis process

Whether you’re tagging findings, crafting YARA rules, or writing case notes, the MITRE integration helps turn technical output into meaningful insight — all from within the MalChela environment.

Sharper Strings and Smarter Signals: MalChela 3.0.1

It’s a strange but satisfying feeling to hit version 3.0, then realize soon after you’re already back in the weeds fixing, refining, and optimizing. That’s what this 3.0.1 release is all about — a tight round of updates aimed at boosting clarity and cutting noise, especially when running mStrings or working within the FileMiner panel. Additionally, a number of optimizations came about in getting MalChela to run smoothly on Toby, and to minimize any unnecessary re-building of the binaries. This post walks through what’s new and improved.


🧠 Smarter Detections in mStrings

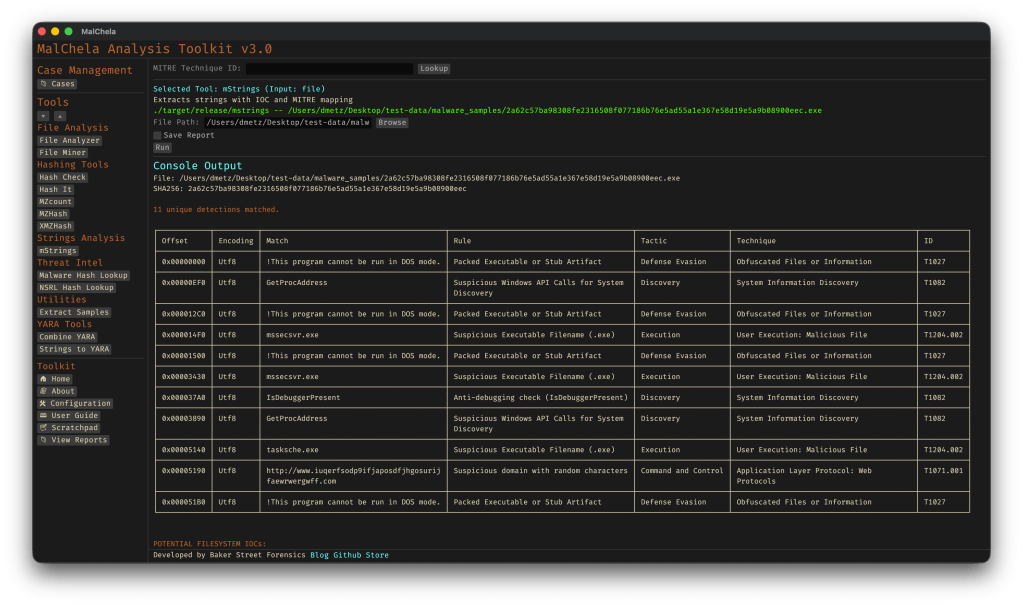
The mstrings tool — one of the most feature-rich in the toolkit — got a round of refinements:

  • Generic Executable detection removed: This was too noisy and matched a lot of clean files. It’s been replaced by more focused patterns.
  • Suspicious DLLs now detected more precisely: Legit Windows DLLs like ole32.dll and gdiplus.dll are now excluded unless they’re paired with indicators like GetProcAddress, LoadLibrary, or manual syscall patterns.
  • Rule cleanup and expansion: Several detections were removed, refined, or added (like packer stubs and dropper markers) to better target actual malicious behavior.
  • Tighter MITRE mapping: Each detection is now carefully aligned to a corresponding MITRE ATT&CK technique, often down to the sub-technique level.

If you’ve ever run mstrings and felt unsure which hits mattered most — or got buried in generic noise — this update should feel much cleaner.

Reminder: You can easily update the detection criteria by modifying detections.yaml.

Have a detection to contribute to the project? Submit a pull request.


🔍 Built-In MITRE Lookup (GUI)

If a detection shows a MITRE ID like T1082, you can now look it up directly inside the GUI. The new MITRE Lookup Bar sits at the top of the config panel (only when running mstrings). Paste a technique ID, hit Lookup, and it’ll open the official MITRE ATT&CK page in your browser.


🗂️ FileMiner Improvements

The FileMiner GUI panel saw some polish too:

  • “Select All” functionality: You can now batch-run tools across multiple matching files in a case — a huge time-saver during triage.

🧰 Build and Setup Updates

Two quick notes for folks cloning the repo for the first time:

  • The release.sh script now builds all binaries in release mode — one command to build everything cleanly.
  • Docs and README were updated to recommend building in –release mode from the start, especially for smoother GUI usage.

🧪 Platform Testing

Confirmed functional on:

  • macOS (Silicon)
  • Ubuntu (Desktop and minimal)
  • REMnux (custom REMnux tools.yaml)
  • Raspberry Pi (Zero 2W and 4B)
  • Windows via WSL (CLI)

Still some quirks with native Windows support due to YARA compatibility and pathing, but if you’re a Windows power user and want to pitch in, I’d love your help.


💭 Final Thoughts

MalChela isn’t trying to replace your favorite tools — it’s trying to bundle them in ways that save time, reveal context, and give you clarity during analysis. The 3.0.1 release doesn’t bring sweeping new features, but it does make the experience tighter, more predictable, and more useful where it counts.

As always, thanks to those who’ve tested it, given feedback, or just watched quietly from the shadows. 🕵️‍♂️ If you want to contribute — whether it’s rules, regex, docs, or bugs — you’ll find me at dwmetz/MalChela.

Happy hunting.


MalChela v3.0: Case Management, FileMiner, and Smarter Triage

With the release of MalChela v3.0, I’m introducing features that shift the focus from tool-by-tool execution to a more structured investigative workflow. While the core philosophy of lightweight, file-first analysis remains unchanged, this version introduces smarter ways to manage investigations, track findings, and automate common analysis patterns, all with minimal fuss.

In this post, I’ll walk through the new Case Management system, the replacement of MismatchMiner with FileMiner, and the ability to identify and launch suggested tools — even in batch — based on file characteristics. These changes aim to reduce friction in multi-tool workflows and help analysts move faster without losing visibility or control.

Cases: A Lightweight Way to Stay Organized

Until now, MalChela has operated in an ephemeral mode. You selected a tool, pointed it at a file or folder, and reviewed the output. Any saved results would be grouped by tool, but without much context.

Cases change that. In v3.0, you can start a new case from a file or folder — and everything from that point forward is grouped under that case. Tool outputs are saved to a dedicated case folder, file hashes are tracked, and metadata is preserved for review or reanalysis.

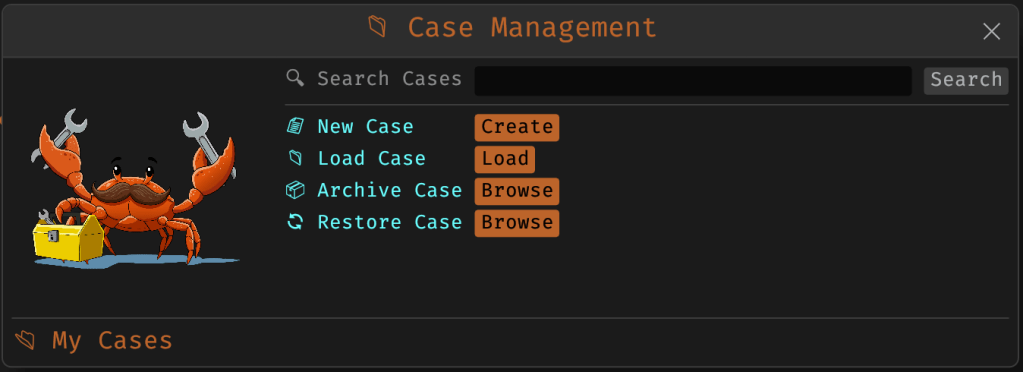
Case Management

You don’t need to create a case for every run — MalChela still supports standalone tool execution. But when you’re working with a malware sample set, an incident directory, or a disk image extract, cases give you the ability to:

  • Save tool results in a consistent location
  • Track analysis history per file
  • Reopen previous sessions with full context
  • Add notes, tags, and categorization (e.g., “suspicious”, “clean”, “needs review”)

Hello FileMiner: Goodbye MismatchMiner

The MismatchMiner tool was originally designed to surface anomalies between file names and actual content — a common trick in malicious attachments or script dropper chains. It worked well, but its scope was narrow.

FileMiner replaces it, expanding the logic to support full file-type classification and metadata inspection across an entire folder. It still flags mismatches, but now it also:

  • Detects embedded file types using magic bytes
  • Groups files by class (e.g., images, documents, executables, archives)
  • Calculates hashes for correlation and NSRL comparison
  • Extracts size, extension, and other key metadata
  • Saves both a human-readable .txt summary and a structured .json report

The output is designed to be used both manually and programmatically — which brings us to one of v3.0’s most important additions: tool suggestions.

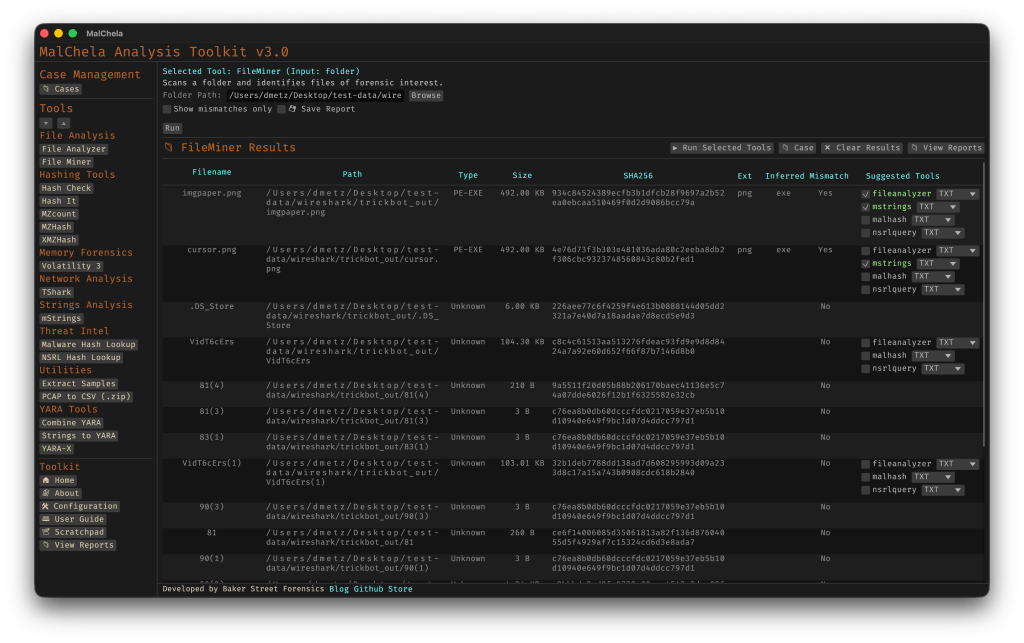
The new FileMiner app

Suggested Tools and Batch Execution

Once FileMiner runs, it doesn’t just stop at reporting. Based on each file’s type and characteristics, it can now suggest one or more appropriate tools from the MalChela suite.  These suggestions are surfaced right in the GUI — or in the CLI if you’re running FileMiner interactively. From there, you can choose to launch the recommended tool(s) on a per-file basis or queue up several for batch execution.

This makes it much faster to pivot from triage to deeper inspection. No more switching tools manually or copying paths. You stay within the flow — and more importantly, you reduce the risk of skipping important analysis steps.

CLI and GUI Improvements Aligned

These features are available in both the CLI and GUI editions of MalChela. In the CLI, FileMiner presents an interactive table of results. You can pick a file, see its suggested tools, and choose which one to run. When you’re done, you can return to the table and continue with the next file.

The GUI extends this even further, allowing you to:

  • View and scroll through full case history
  • Run tools with live output streaming
  • Reopen previous FileMiner runs from saved reports
  • Run all suggested tools on all files with one click (if desired)

These features let you treat MalChela more like a toolbox with memory, not just a launcher.


CLI Enhancements:

The command-line interface has also received a quiet but meaningful upgrade. Tool menus are now organized with clear numeric indexes and shortcodes, making it faster to navigate and launch tools without needing to retype full names. This small change goes a long way during repetitive tasks or when working in a time-constrained triage setting.

FileMiner supports an interactive loop: after running a tool on a selected file, you’re returned to the main results table — no need to restart the scan or re-navigate the menu. This allows you to run additional tools on different files within the same dataset, making FileMiner feel more like a lightweight control center for follow-up actions. It’s a subtle shift, but one that significantly reduces friction in batch-style or exploratory workflows.


Closing Thoughts

MalChela 3.0 reflects a steady evolution — not a revolution. It’s built on real-world feedback and a desire to make forensic and malware analysis a little less scattered. Whether you’re a one-person IR team or just trying to stay organized during a reverse engineering exercise, the new case features and smarter triage capabilities should save you time.

If you’ve been using MalChela already, I think this update will feel like a natural (and welcome) extension. And if you haven’t tried it yet, there’s never been a better time to start.

Download: https://github.com/dwmetz/MalChela/releases

User Guide: https://dwmetz.github.io/MalChela/